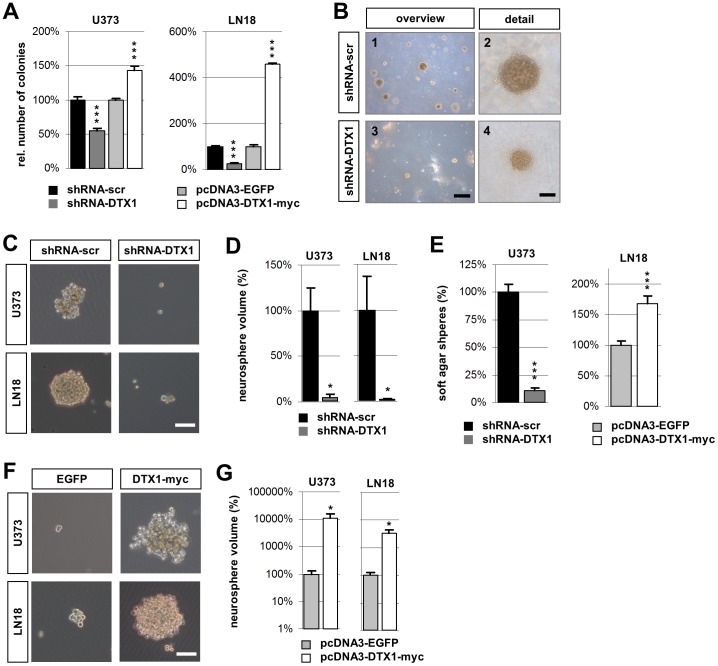
Figure 4. DTX1 regulates the clonogenic capacity of U373 and LN18 glioma cells.
(A) Quantification of colonies formed in low density seeding assay after 21d. All colonies were included irrespective of size. Values were normalized to the control cell line. (B) Soft agar colony formation assay shown as light microscopic overview images (1, 3) or detailed close up images (2, 4) of a representative individual colony showing surface independent growth in 0.3% agar. Scale bars: overview 400 µm; detailed view 80 µm. (C) Floating cancer spheres of control (left) or DTX1 down regulated (right) cells grown in NBE medium for 24 days shown as light microscopic images. (D) Relative average volume of neurospheres shown in (C). (E) Quantitative analysis of the number of colonies formed after 15d of incubation in soft agar shown in (B). (F) Floating cancer spheres of control (left) or DTX1 over expressing cells (right) grown in NBE medium for 5 days shown as light microscopic images. (G) Relative average volume of neurospheres shown in (F). Scale bars (C, F): 150 µm. Average values are shown. Error bars: ±SEM. *p<0.05, *** p<0.001.

