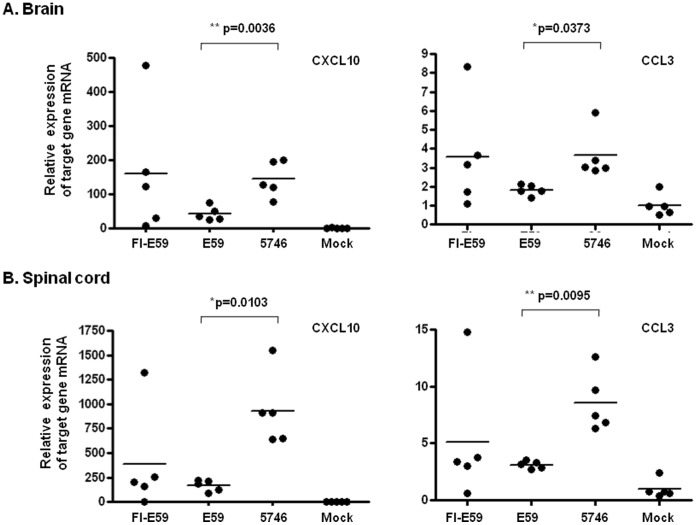
Figure 9. Expression of CXCL10 and CCL3 in the CNS of different genotype of EV71- or FI-E59 vaccine-inoculated mice.
After a 7 d injection s.c. of 1-day-old hSCARB2-Tg with 1×10⁷ pfu of E59, 3×10⁴ pfu of 5746, or 1 µg of FI-E59, RNA was extracted from the brainstem (A) and spinal cord (B) and quantitative RT-PCR analysis was conducted to quantify CXCL10 and CCL3 genes. hSCARB2-Tg mice that received no EV71 (mock) were set as the negative control. The relative expression of chemokines was calculated as described in the legend of Fig. 6. The statistical average from 5 mice per group is shown. Unpaired student t test with Welch’s correction was used for statistical analysis.

