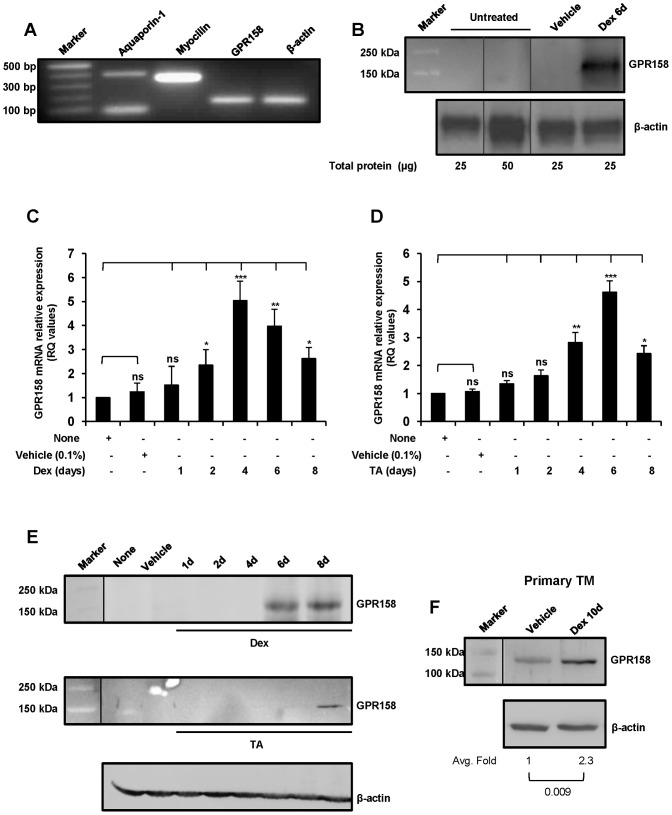
Figure 2. Expression and GC-mediated induction of GPR158 in trabecular meshwork cells.
(A) RT-PCR analysis of GPR158, aquaporin-1, myocilin and β-actin mRNA expression in TBM-1 cells. (B) Western blotting for GPR158 in cellular extracts from untreated and Dex treated (250 nM) for 6 days using anti-C-terminal GPR158 antibodies (1∶1000 dilution). The data are representative of three independent experiments. The vertical line indicates repositioned gel lanes. (C and D) TBM-1 cells were stimulated with either Dex (C) or TA (D) for the indicated time periods. Total RNA was isolated for quantitation of GPR158 mRNA by qRT-PCR. GAPDH was used as a reference gene. The cells treated with ethanol (0.1%) were used as a negative control. The data are representative of three independent experiments. ***P<.001; **P<.01, *P<.05; ns, P>.05. (E) The stimulation of TBM-1 cells was carried out with either Dex (top panel) or TA (middle panel) OR primary TBM cells were treated with either Dex or vehicle alone (F), for indicated time points. Following treatment, the cells were lysed with RIPA lysis buffer and cellular extracts were prepared. The protein lysates were then loaded onto SDS-PAGE to perform western blotting for GPR158 protein using indicated anti-C-terminal GPR158 antibodies. The same membrane was stripped and reprobed for β-actin. The data are representative of three independent experiments. (F) Quantification of GPR158 protein band intensities was measured by NIH Image J, normalized by β-actin band intensities and expressed in terms of fold expression relative to levels in vehicle treated cells arbitrarily set at 1.0. The statistical analysis was carried out using unpaired Student's t tests (P<0.05). The average fold and P values obtained from three different experiments are indicated in the figure. The vertical line in Fig. 2, E and F indicates repositioned gel lanes.

