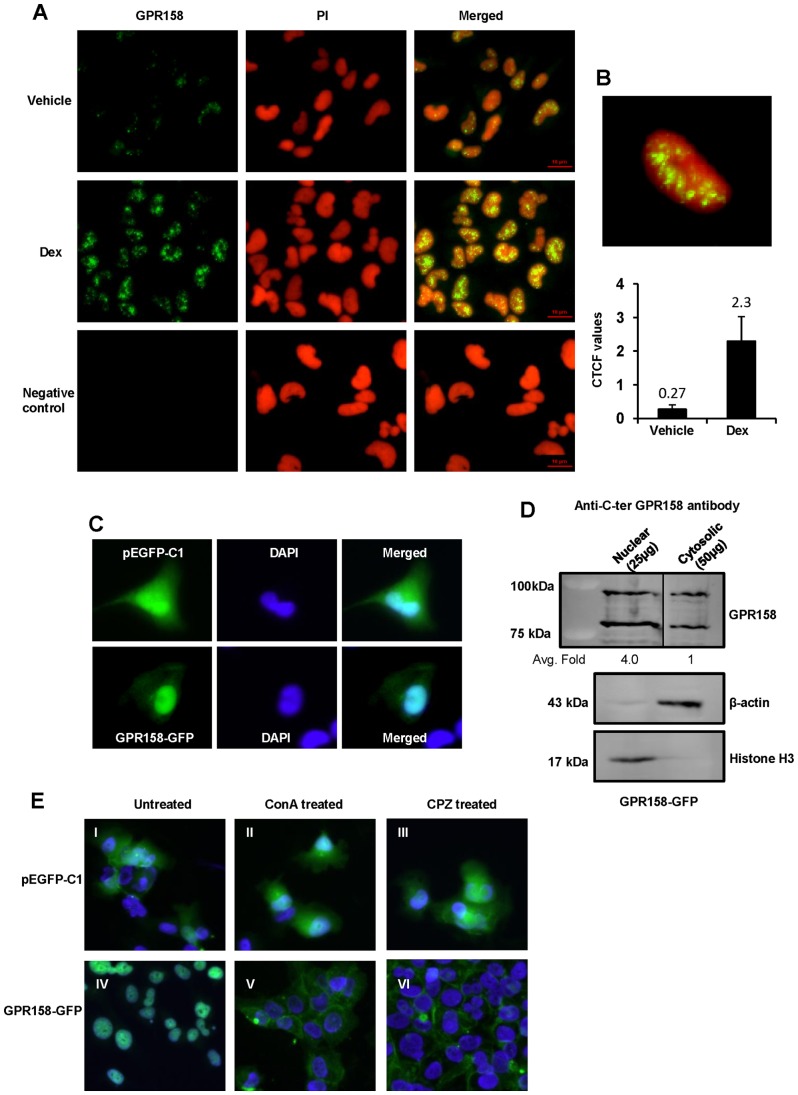
Figure 6. Nuclear trafficking of GPR158.
(A) Indirect immunofluorescence microscopy was carried out using anti-C-terminal GPR158 antibody in vehicle treated (top panel) or Dex treated (middle panel) TBM-1 cells. The untreated cells labeled only with secondary and not with primary anti-GPR158 antibody, as negative control are indicated in bottom panel. Cell nucleus was labeled with propidium iodide (PI). All images were captured using Nikon Eclipse Ti-E fluorescence microscope at fixed acquisition parameters. Yellow indicates the colocalization of GPR158 with nuclear stain in merged images. (B, top panel) The image represents the z-stack projection of multiple confocal microscopy sections from the basal to the apical cell side, indicating the co-localization of GPR158 (green) with nuclear stain, PI (red). (B, bottom panel) The corrected total cell fluorescence (CTCF) from 50 individual cells in either vehicle or Dex treated sample was measured using NIH Image J software and normalized with negative control values. The bar diagram represent mean ± SEM of three independent experiments. The statistical analysis was carried out using unpaired Student's t tests (P<0.05). (C) The images were acquired using fluorescence microscopy of cells transfected with either vector or GPR158-GFP fusion plasmid. The representative image of single cell for both panels is shown from three independent transfection experiments. Post-transfection, the cells were fixed with 4% PFA, washed with PBS and the slides were mounted using VECTASHIELD with DAPI. The images were acquired on Nikon Eclipse Ti-E fluorescence microscope. (D) The nuclear extracts (25 µg) and cytosolic extracts (50 µg) isolated from cells overexpressing GPR158-GFP fusion protein were subjected to SDS-PAGE and western blotting to detect GPR158 using anti-C-terminal GPR158 antibody (dilution: 1∶1000), as described in Materials and Methods. The purity of nuclear and cytosolic extracts in immunoblotting was confirmed using anti-beta actin and anti-histone H3 antibodies. Quantification of both fragments of GPR158 protein band intensities was measured by NIH Image J and expressed in terms of fold levels relative to levels in cytosolic extracts considered as 1.0. The statistical analysis was carried out using unpaired Student's t tests (P<0.05). The average fold and P values obtained from three different experiments are indicated in the figure. The vertical line indicates repositioned gel lanes. ***P<.001; **P<.01, *P<.05; ns, P>.05. (E) TBM-1 cells were either transfected with GFP vector alone (I, II and III) or GPR158-GFP plasmid (IV, V and VI). 3 days after transfection, the cells were either incubated in culture media (I and IV) or media containing ConA (II and V) (0.25 mg/mL) for 8 hrs or CPZ (III and VI) (10 µM) for 3 hrs. Following treatment, the cells were washed with PBS and fixed with 4% PFA for 20 mins at RT. The cells were washed again and mounted with VECTASHIELD containing DAPI and images were acquired with a Nikon Eclipse Ti-E fluorescence microscope. The images represent two independent experiments.

