
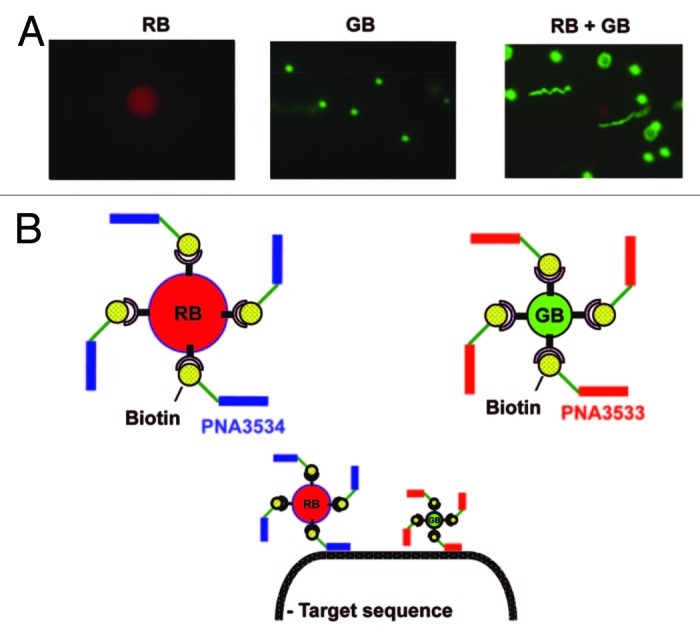
Figure 5. (A) Fluorescent microscopic images of the green bead (GB), the red bead (RB) and a mixture of the two. (B) Representation of PNA3534 which has been coupled to RB, of PNA3533 which has been coupled to GB, and of the target sequence detection by two bead/PNA complexes. Adapted with permission from reference 49.