
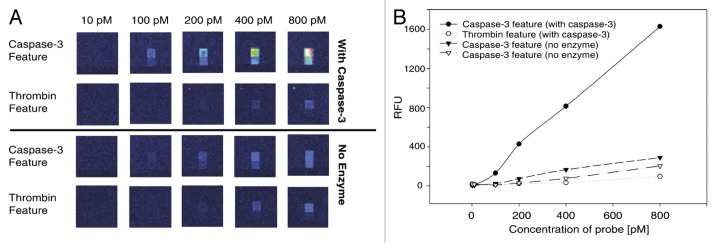
Figure 8. (A) Affymetrix microarray after proteolysis of two different substrates (Caspase-3 and Thrombine feature) prior to and after incubation with the enzyme Caspase-3, at different concentrations in substrates. (B) Plots of relative fluorescence intensities as a function of the concentration in substrates. Adapted with permission from reference 52.