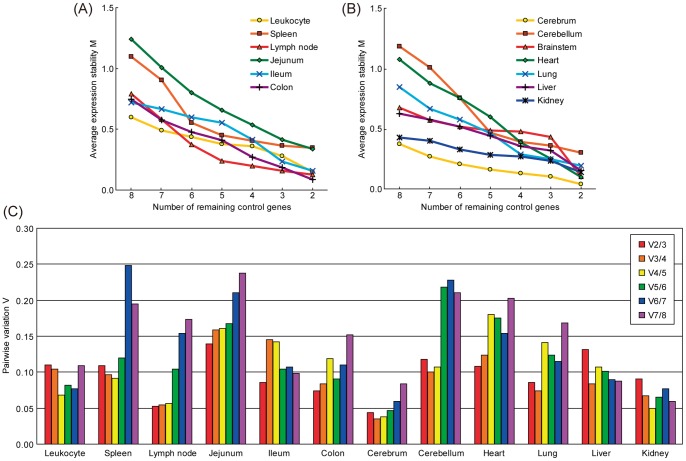
Figure 2. Gene expression stability and pairwise variation of candidate reference genes using geNorm analysis.
(A) and (B): Average gene expression stability values M of the remaining reference genes during stepwise exclusion of the least stable gene in the different tissue panels are shown. Data are divided into two figures to avoid closely-packed lines. See also figure 3 for the ranking of genes according to their expression stability. (C) Pairwise variation analysis was used to determine the optimal number of reference genes for use in qPCR data normalization. The recommended limit for V value is 0.15, the point at which it is unnecessary to include additional genes in a normalization strategy.

