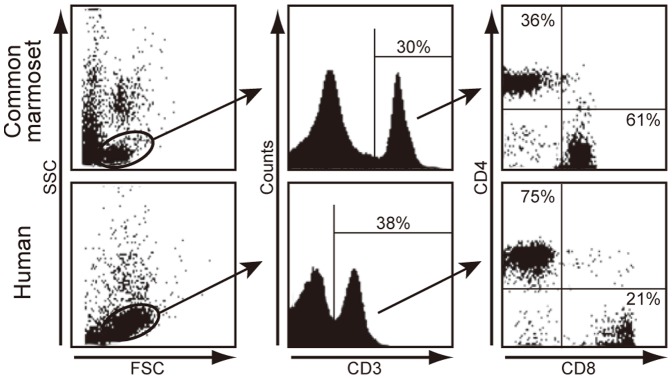
Figure 6. The ratio of CD4+ to CD8+ cells in common marmoset and human peripheral blood mononuclear cells (PBMCs) by flow cytometry.

Representative scattered plots of FSC and SSC are shown in the left panels. Middle panels represent a histogram of CD3 analyzed in the lymphocyte gate. Gated CD3+ cells were analyzed for CD4 and CD8 expression (right panels).
