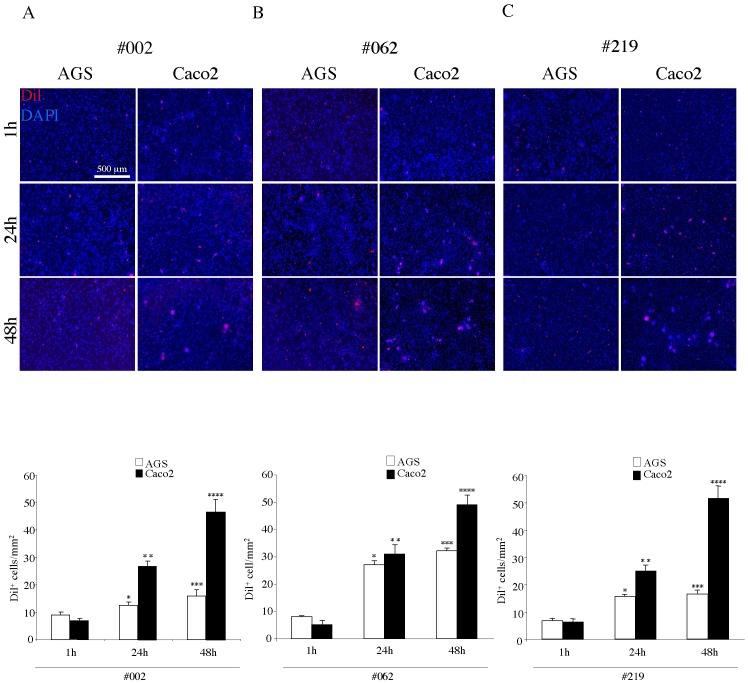
Figure 4. Adhesion test with AGS and Caco2 cells on different HPMC monolayers.
HPMCs isolated from the peritoneal wash of a non-cancer patient (A, #002), from that of a colon cancer patient (B, #062) and from that of a gastric cancer patient (C, #219), were grown to confluent monolayer as above. Caco2 and AGS cells were labeled with DiI, seeded on the HPMC layers, left to adhere for different time points (1, 24 and 48 hours) and then washed, fixed and permeabilized. Nuclei were stained with DAPI. Quantitative analysis of the number of adherent DiI+ cells/mm2 was performed as described in materials and methods. Independently on the origin of the peritoneal washes, the Caco2 cells show higher levels of adhesion respect to AGS at 24 and 48 hours. However, while the adhesion of the Caco2 cells is similar to all mesothelial layers, the AGS cells display significant differences, showing higher adhesion to the layer #062 respect to the #219 and the #002. Results of the quantitative analysis are expressed as mean values ± IC 95%. Kruskal-Wallis test: A) *p<0.05 vs the AGS 1 hour; **p <0.01 vs Caco2 1 hour, p <0.01 vs AGS 24 hours; ***p <0.05 vs the AGS 1 hour and p = NS vs the AGS 24 hours; ****p <0.01 vs Caco2 24 hours. B) *p <0.01 vs the AGS 1 hour; **p <0.01 vs Caco2 1 hour, p = NS vs AGS 24 hours; ***p <0.01 vs the AGS 1 hour, p = NS AGS 24 hours; ****p <0.01 vs Caco2 24 hours. C) *p <0.01 vs the AGS 1 hour; **p <0.01 vs Caco2 1 hour, p <0.01 vs AGS 24 hours; ***p <0.05 vs the AGS 1 hour, p = NS 24 AGS hours; ****p <0.001 vs Caco2 24 hours.

