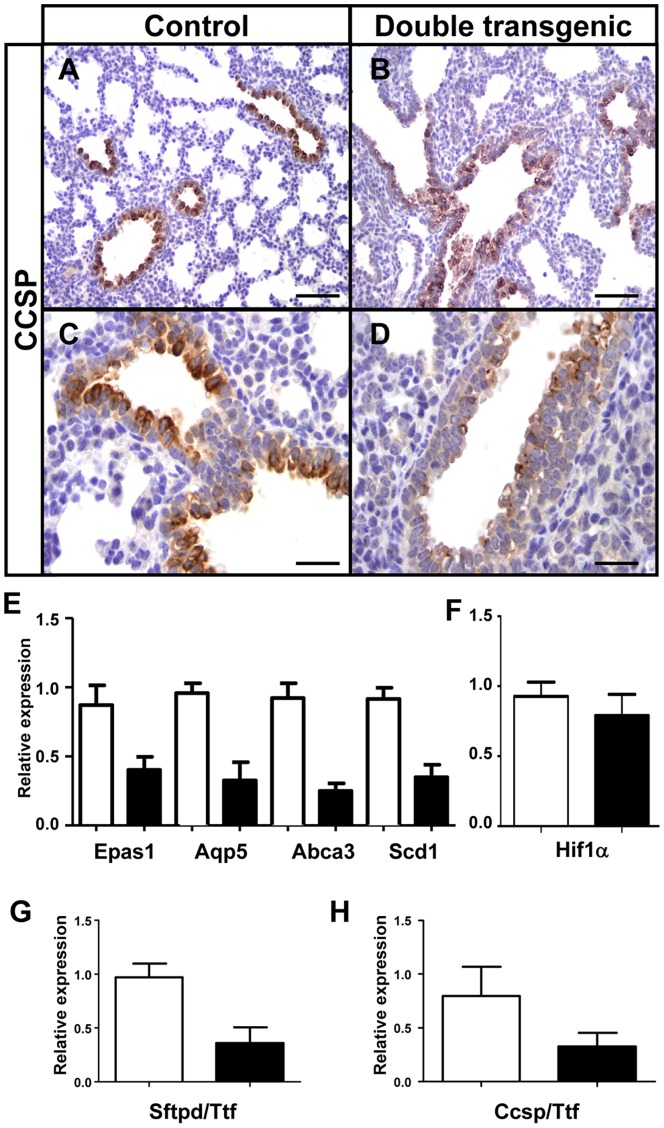
Figure 6. mycHIF3α reduces the number of Clara cells.
The expression of the Clara cell marker, Ccsp, was strongly decreased in mycHIF3α transgenic lungs at gestational age E18.5 compared to controls (A and C versus B and D). (E) Alveolar epithelial cell markers are downregulated in Hif3α transgenic lungs at gestational age E18.5 as shown by quantitative PCR. Epas1 (0,4 + 0.1 versus control 0.87 + 0.1, n = 3 each, P = 0.012), Aqp5 (0.33+ 0.1 versus control 0.96 + 0.1, n = 3 each, P = 0.005), Abca3 (0.25 + 0.1 versus control 0.92 + 0.1 n = 3 each, P = 0.002), Scd1(0.35 + 0.1 versus control 0.92 + 0.1, n = 3 each, P = 0.001). (F) There is no significant change in the mRNA expression of Hif1α gene (0,8 + 0.1 versus control 0.7 + 0.1, n = 3 each, P>0.05). Quantification of the number of (G) type II pneumocytes (Sftpd over Ttf1, 0.36 + 0.1 versus control 0.9 + 0.1; n = 3, P = 0.01) and (H) Clara cells (Ccsp over Ttf1, 0.3 + 0.1 versus control 0.82 + 0.1; n = 5, P = 0.01) showed a significant reduction of in the Hif3α double transgenic animals. White bars represent control lung samples, black bars represent mycHIF3α double transgenic lung samples. Scale bars: 100 µm (A, B) and 50 µm (C,D).

