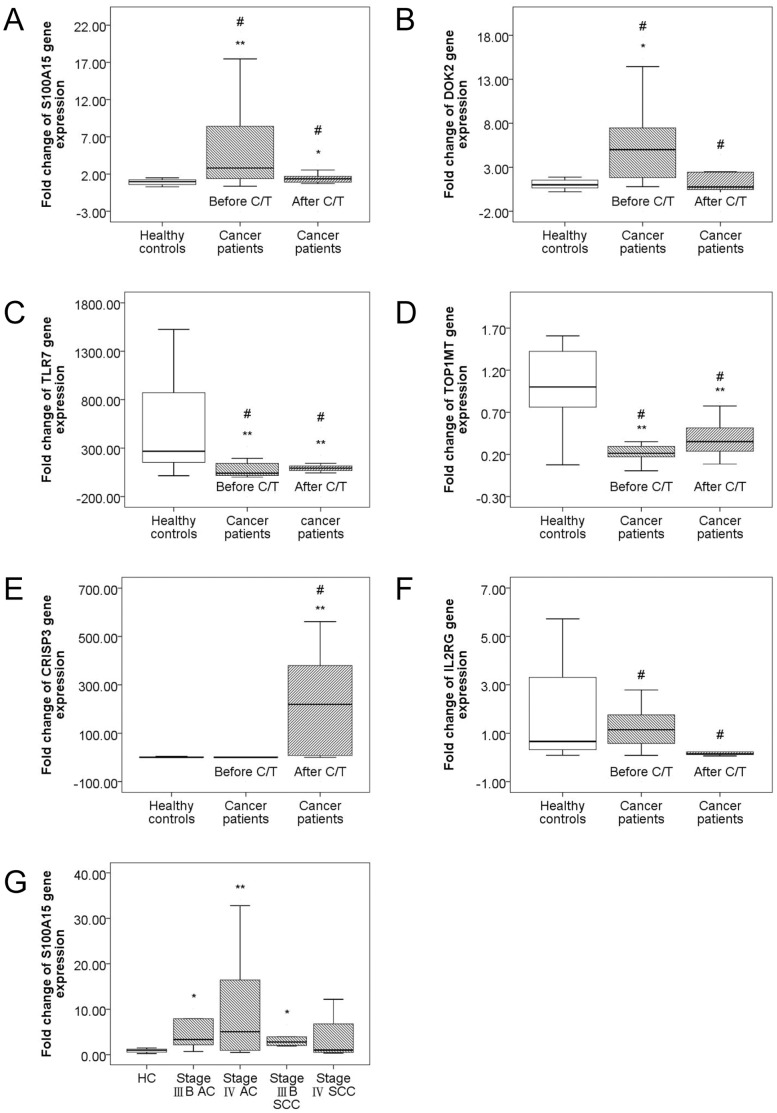
Figure 3. Confirmation of microarray results with TaqMan real-time RT-PCR.
The box plots show the 25th, 50th, and 75th percentiles, maximum, and minimum. For all cancer patients (striped box, N = 30) and healthy controls (HC, blank box, N = 20), expression levels of the six selected genes were measured using TaqMan real-time RT-PCR on the same RNA samples used for the microarrays. Median expression levels are shown for S100A15 (A), DOK2 (B), TLR7 (C), TOP1MT (D), CRISP3 (E), IL2RG (F). S100A15 and DOK2 were up-regulated in NSCLC patients compared to the HC, whereas TLR7 and TOP1MT were down-regulated. S100A15, DOK2, and IL2RG were down-regulated after chemotherapy, whereas TLR7, TOP1MT, and CRISP3 were up-regulated after chemotherapy. (G) Median expression level in parallel with the results of unsupervised hierarchical clustering is shown for S100A15, a cluster 1 gene with greater expression levels in stage IIIB AC, stage IIIB SCC, and stage IV AC compared to the HC, and a peak expression in stage IV AC. * p<0.05, compared with the healthy controls. ** p<0.01, compared with the healthy controls. # p<0.05, compared before and after chemotherapy.

