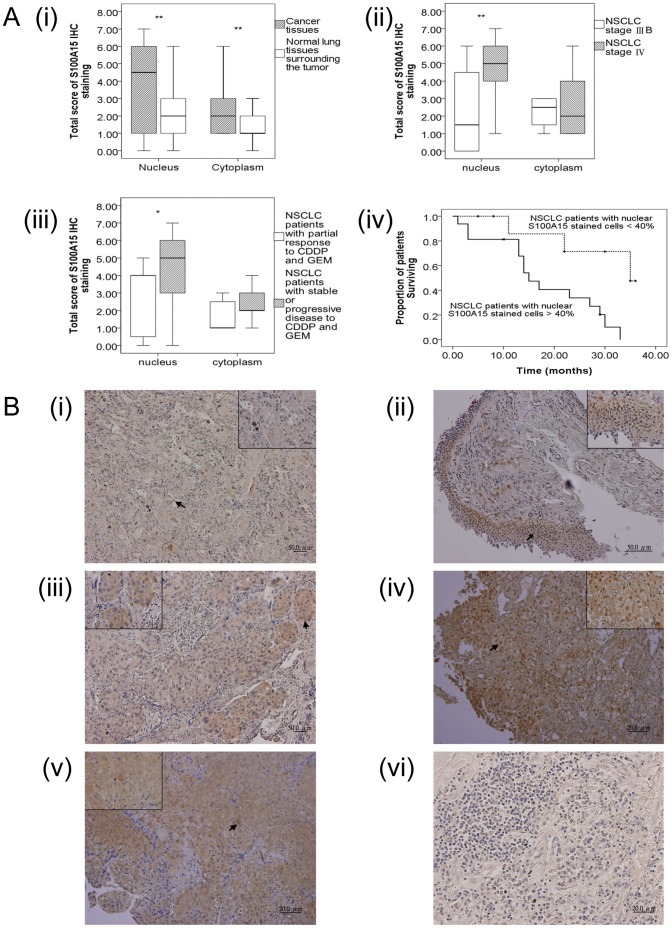
Figure 4. Immunohistochemistry (IHC) staining for S100A15.
(A) Box-plot analysis by Mann-Whitney U test: The box plots show the distribution of nuclear and cytoplasmic total scores based on IHC of S100A15 protein in paraffin-embedded sections of cancer tissues and normal lung tissues surrounding the tumor. The box plots show the 25th, 50th, and 75th percentiles, maximum, and minimum of the total immunostaining score (IHC scoring range 0–7). (i) Comparison of nuclear and cytoplasmic S100A15 expression between cancer tissues and normal lung tissues surrounding the tumor (N = 26) with a p value<0.01(**); (ii) Comparison of nuclear and cytoplasmic S100A15 expression between stage IIIB (N = 12) and stage IV (N = 14) non-small cell lung cancer with a p value<0.01(**); (iii) Comparison of nuclear and cytoplasmic S100A15 expression between patients with a partial response to combination chemotherapy (N = 7) with CDDP and GEM and those with stable or progressive disease (N = 19) with a p value <0.05(*). (iv) Kaplan-Meier survival curves for the 26 NSCLC patients with separate lines according to the percentage of nuclear S100A15 stained cells at a cut-off level of 40% showed significant differences in three-year survival rate (p = 0.008). (B) IHC analysis of S100A15 in paraffin-embedded sections of histologically proven adenocarcinoma (AC) and squamous cell carcinoma (SCC). (i) Normal lung tissues surrounding the tumor showing no nuclear and weak cytoplasmic S100A15 immunostaining; (ii) Stage IIIB AC showing scarce nuclear and weak cytoplasmic S100A15 immunostaining; (iii) Stage IIIB SCC showing weak nuclear and moderate cytoplasmic S100A15 immunostaining; (iv) stage IV AC depicting strong nuclear and moderate cytoplasmic S100A15 immunostaining; (v) stage IV SCC depicting strong nuclear and strong cytoplasmic S100A15 immunostaining; (vi) NSCLC used as a negative control showing no S100A15 immunostaining in the tumor cells, where the primary antibody was replaced by isotype specific non-immune mouse IgG. Arrows show nuclear and cytoplasmic localization (i-vi, original magnification × 100). Insets within the images show close-ups of the cells surrounding the arrows (I–V, original magnification × 400).

