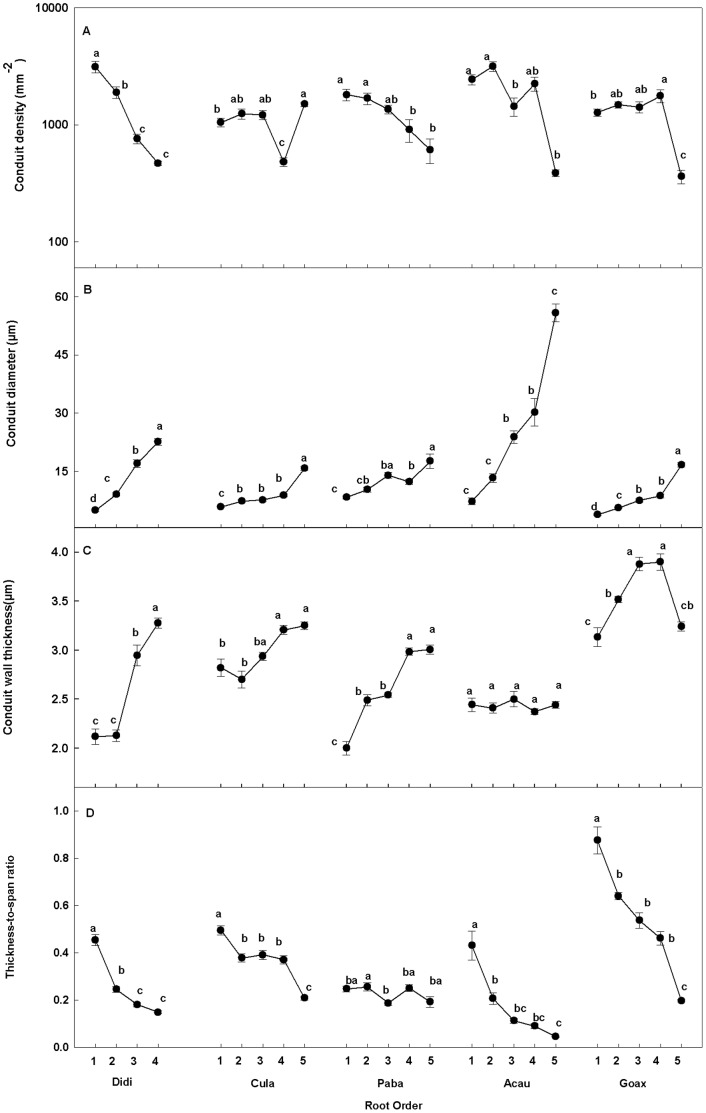
Figure 2. Conduit traits along five orders for five species.
Conduit density (A), conduit diameter (B), conduit wall thickness (C) and conduit thickness to span ratio (D) among the first five orders of five species. Error bars represent one standard error of the mean. Lowercase letters that differ among root branches within a species indicate a significant difference (P<0.05). Abbreviations for species are given in Table 1.

