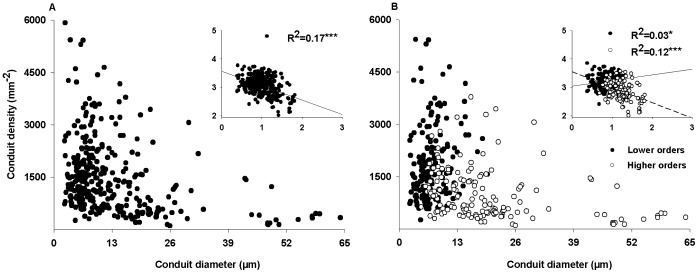
Figure 4. Relationships between conduits density and diameter.
The relationships between conduits density and hydraulic weighted conduit diameter for all species (A), lower orders (closed circles) and higher orders (open circles) (B). See Figure 5 for the lower and higher orders’ classification of each species. Linear regressions with log-transformed data are as detailed in insets with solid line for all species (A) and the lower orders (B), and with dash line for the higher orders in (B). *, **and *** are the significant level at 0.05, 0.01 and 0.001, respectively.

