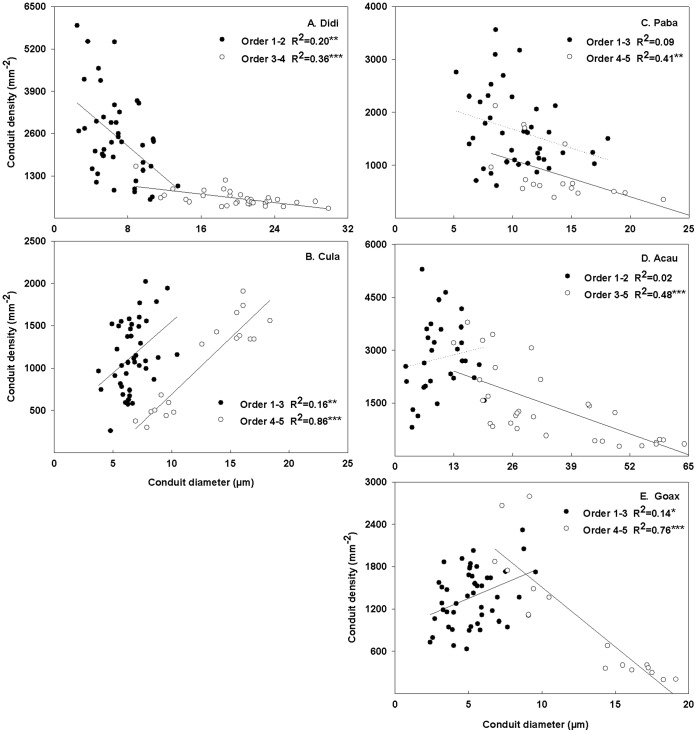
Figure 5. Relationships between conduits density and diameter for each species.
The relationships between conduits density and hydraulic weighted conduit diameter for lower and higher orders in each of five species. The lower (closed circles) and higher orders (open circles) are classified by the presence of secondary xylem. Significant regressions are indicated as solid lines and dotted line are noted as non-significant regressions. *, **and *** represent the significant level at 0.05, 0.01 and 0.001, respectively. See Table 1 for species abbreviations.

