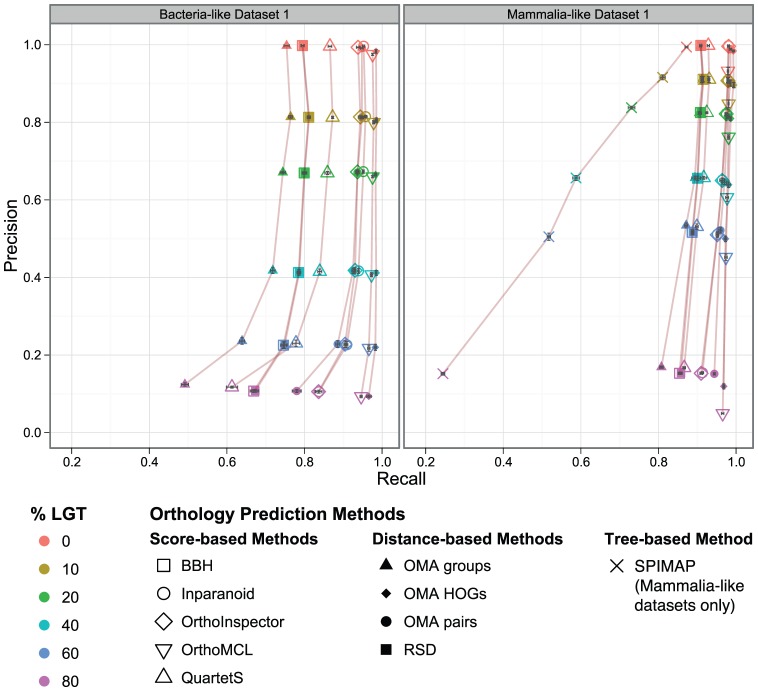
Figure 3. Orthology inference vs. LGT.
Precision/recall of orthology predictions with different proportions of genes with a history of lateral gene transfer. Each data point corresponds to the mean over all orthologous relations in five replicates (with 95% confidence interval of the mean values in both dimensions).

