
Figure 5. Alignment score vs. distance.
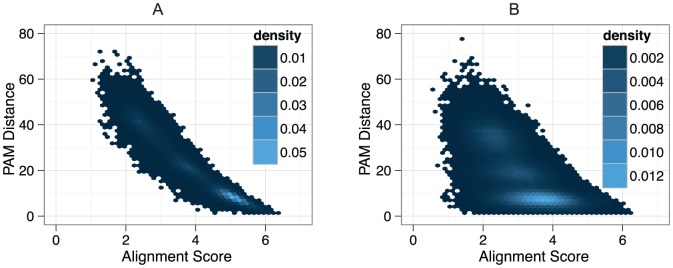
Pairwise alignment scores compared to Percent Accepted Mutation (PAM) distance for one run of mammalia-like dataset 1. A) For insertion and deletion rate 0.001. Scores were normalised by the sum of the aligned characters in both sequences.  ; B) with 18 percent ambiguous characters. Scores were normalised by the sum of the aligned characters in both sequences.
  .
.