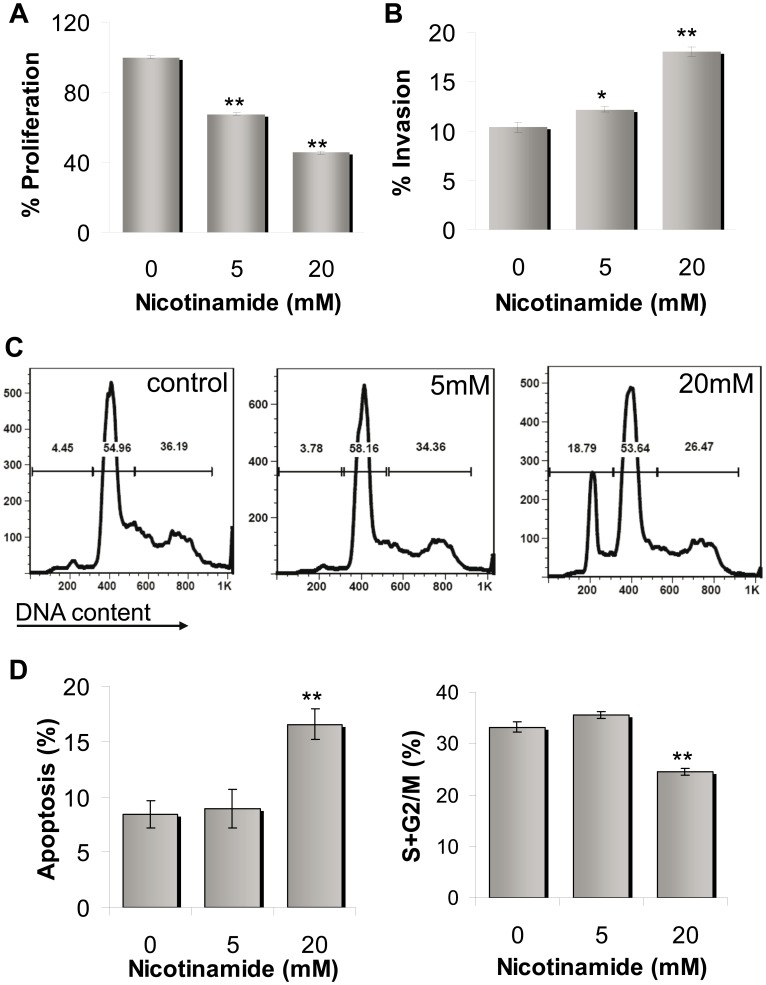
Figure 5. Effect of NA on proliferation, invasion and cell cycle profile of melanoma cells.
(A) Net proliferation of HAG cells was quantified with standardized XTT test. The number of cells was determined 72 h after seeding. The number of the vehicle-treated control cells was determined as 100%. Figure shows a representative experiment out of four performed; (B) Invasion capacity of HAG cells was quantified by 24 h-matrigel invasion assay, with correction to proliferation. The invasion rate of the vehicle-treated control cells was determined as 100%. Figure shows a representative experiment out of three performed; (C) DNA flow cytometry of HAG cells in response to NA compared with vehicle-treated control cells-representative experiment; (D) Quantitative evaluation of the S+G2M subpopulation and the apoptotic cell fraction, measured as a subdiploid peak. Statistically differences compared with control. * indicate P<0.05, ** indicate P<0.01 (2-tailed t-test).

