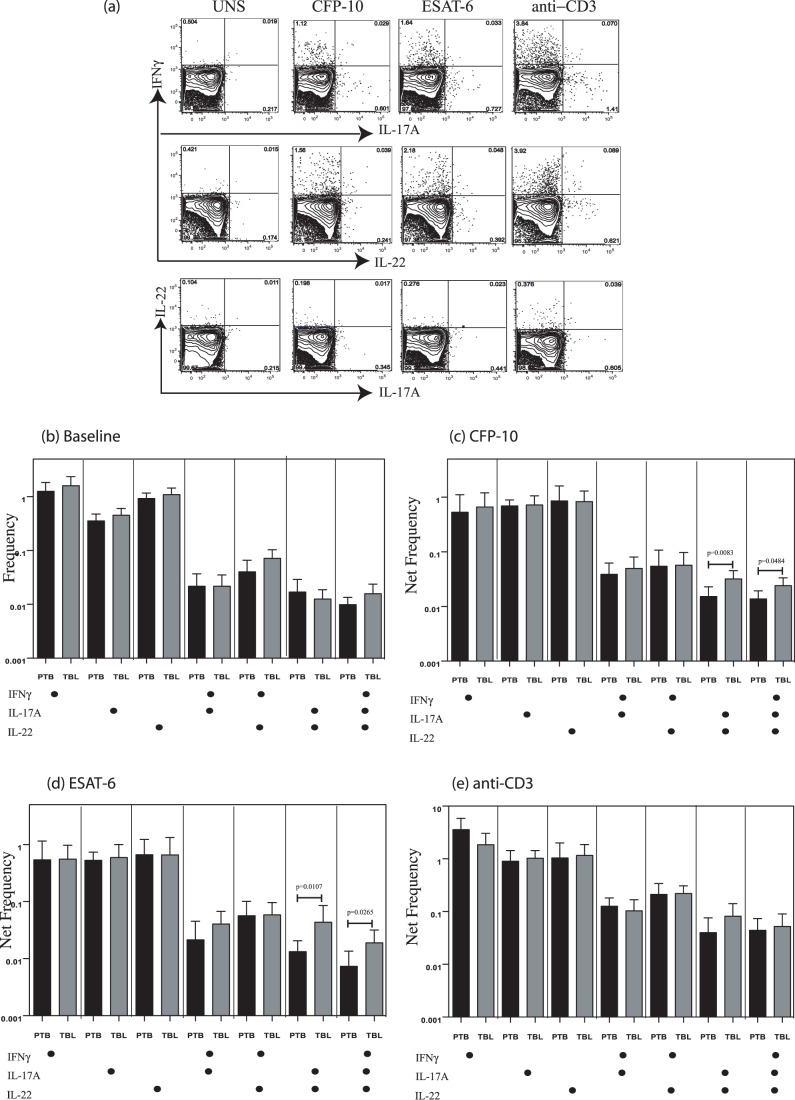
Figure 3. Elevated frequencies of IL-22+IL-17A+ and IL-22+IL-17A+IFN-γ+ CD4+ T cells but not conventional Th22 cells in tuberculous lymphadenitis (TBL).
(A) Representative whole-blood intracellular cytokine assay flow data from a TBL individual showing expression of IL-22, IL-17A, and IFN-γ. The plots shown are gated on CD3+CD4+ T cells. (B) Baseline frequency of CD4+ T cells expressing one, two, or three cytokines (IL-22, IL-17A, and IFN-γ) is shown as bar graphs. The bar represents the geometric mean of the frequency of CD4+ T cells expressing the respective cytokine(s), and the error bar represents the 95% confidence interval in TBL (n = 24; grey bar) and pulmonary TB (PTB) (n = 18; black bar) individuals. (C, D) Net frequency of CD4+ T cells expressing one, two, or three cytokines in response to CFP-10 (C) and ESAT-6 (D) is shown in TBL and PTB individuals. (E) Net frequency of CD4+ T cells expressing the different cytokines in response to anti-CD3 stimulation is shown in TBL and PTB individuals. P values were calculated using the Mann-Whitney test.

