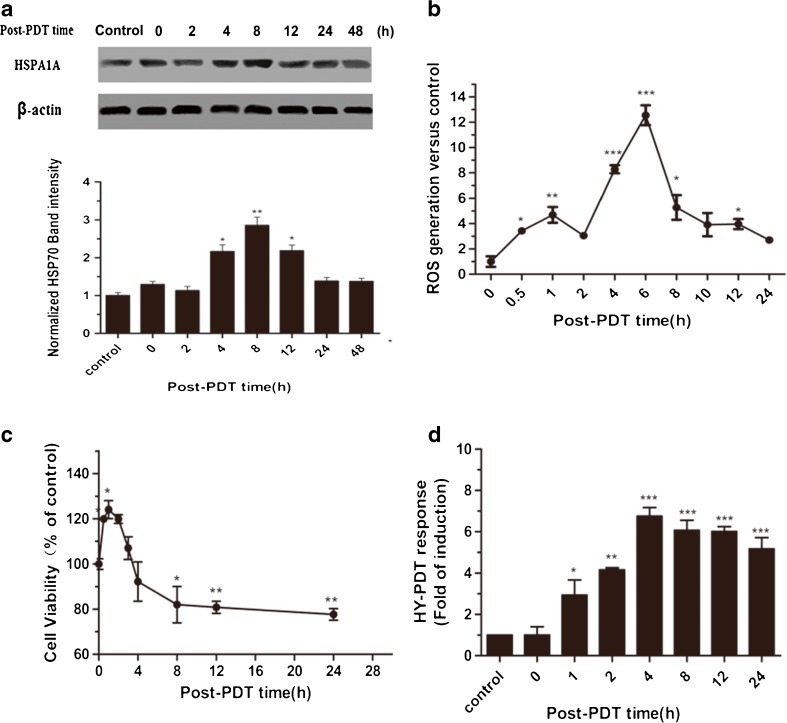
Fig. 4.
Time course results of HSPA1A protein level, cell viability, intracellular ROS level, and promoter activity. MCF7-luciferase cells were treated with 0.125 μM Hyp for 16 h and exposed to a light dose of 3.87 J/cm2. At the indicated time points after irradiation, cells were collected and detected HSPA1A protein level, luciferase activity, cell viability, and ROS level. a HSPA1A levels detected by Western blot after PDT and hyperthermia treatments. The untreated cells were used as a control. β-actin was used as the loading control. b The time course of ROS generation after PDT. Results are indicated as values relative to the control group. Changes in cell viability estimated by intracellular ATP quantification are shown in (c). The changes in luciferase activity of MCF7-luciferase cells are described in (d). Relative luciferase activity was measured using the luciferase assay system. In (c) and (d), all the values are shown relative to time-matched results from cells without PDT treatment. Histograms show the PDT response of MCF7-luciferase cells as folds of induction. Data represent mean ± SD of three individual experiments

