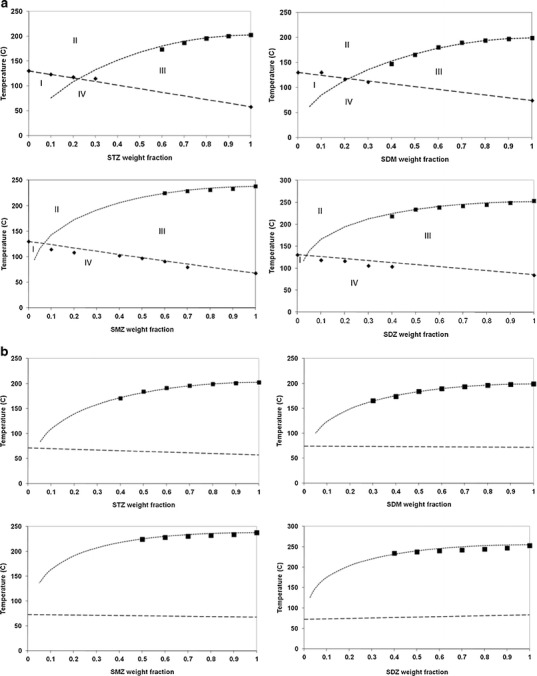
Fig. 5.

T end (dissolution endpoint) and Tg (glass transition temperature) as a function of API concentration. Diamonds represent experimental Tg, squares represent experimental T end, dashed line represents the Gordon–Taylor law, dotted line represents T end calculated from Eqs. 1 and 2. a API/PVP systems. b API/Soluplus® systems
