
Fig. 2.
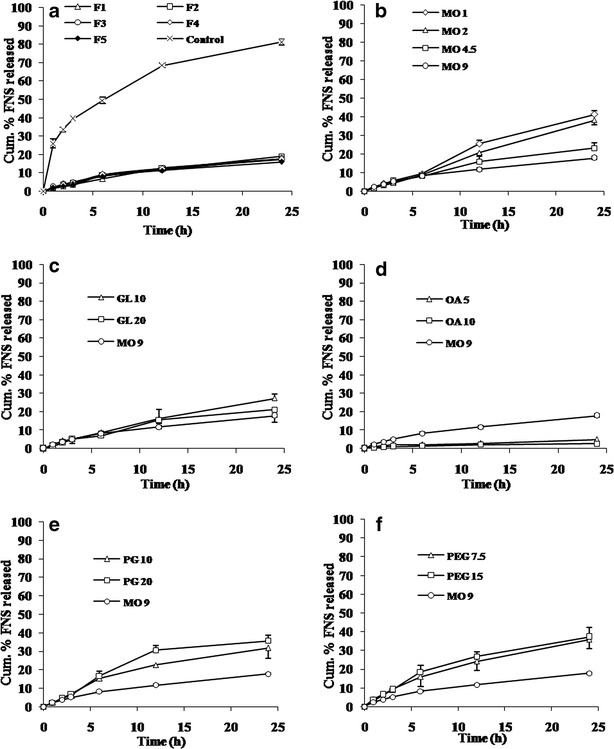
Cumulative release profile of FNS from LCN. Each value represents mean ± SD (n = 3). a Effect of poloxamer 407. b Effect of MO. c Effect of GL. d Effect of OA. e Effect of PG. f Effect of PEG
Official websites use .gov
A
.gov website belongs to an official
government organization in the United States.
Secure .gov websites use HTTPS
A lock (
) or https:// means you've safely
connected to the .gov website. Share sensitive
information only on official, secure websites.
Cumulative release profile of FNS from LCN. Each value represents mean ± SD (n = 3). a Effect of poloxamer 407. b Effect of MO. c Effect of GL. d Effect of OA. e Effect of PG. f Effect of PEG