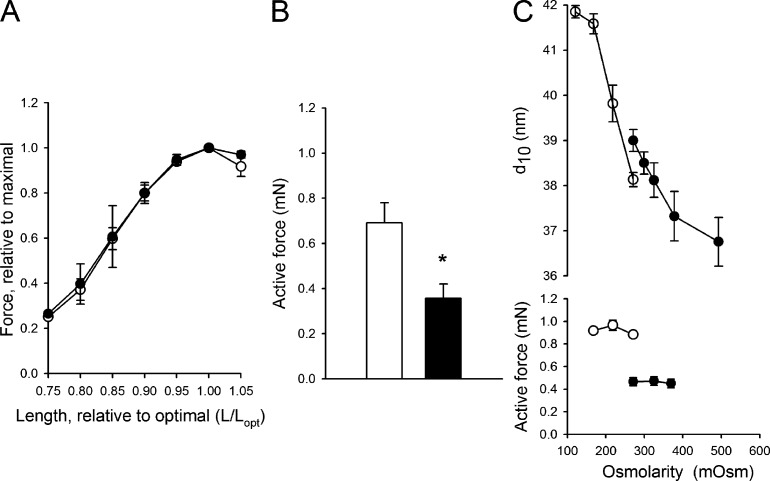
Figure 4.
Length–tension relationship and maximal active force in skeletal muscles. Data from 4-dpf control (open symbols) and desmin morphant (closed symbols) zebrafish larvae are shown. Muscles were stimulated to give single twitches. (A) Force and length values are given relative to the respective values at optimal length (Lopt). (B) The maximal active force at Lopt is presented. n = 6; *, P < 0.05. (C) The equatorial 1.0 spacing (top) and active force (bottom) of the muscles at Lopt examined at different osmolarities. Control (open symbols) and desmin morphants (closed symbols) are shown, n = 4 in each group. Error bars indicate mean ± SEM.

