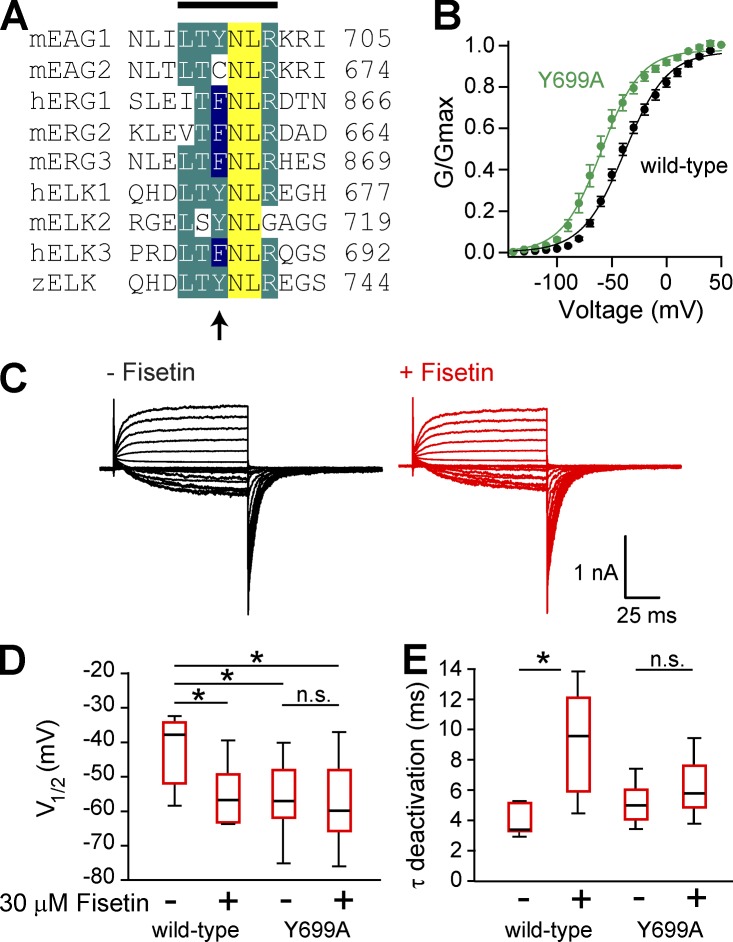
Figure 8.
Fisetin did not potentiate mEAG1 channels with a mutated intrinsic ligand. (A) Alignment of the intrinsic ligand from each of the eight members of the KCNH channel family. Line on the top marks the boundaries of the intrinsic ligand, and the arrow on the bottom denotes the Y699 residue in mEAG1 channels. (B) The conductance–voltage relationship of wild-type (black) and Y699A (green) mEAG1 channels recoded in the inside-out patch configuration (n = 17). (C) Representative current traces from Y699A mutant channels recorded in the absence (black) and presence (red) of 30 µM fisetin. (D) Box plot distribution of the V1/2 of the conductance–voltage relationship for both wild-type and mEAG1 Y699A channels with 0 or 30 µM fisetin as indicated (n = 6–10). A two-way ANOVA reported differences between these four groups of data (P < 0.01). The Tukey–Kramer post-hoc test revealed significant differences between treatments, denoted with an asterisk. Treatments with nonsignificant differences are also indicated (n.s.). (E) Box plot distribution of the time constant of deactivation for both wild-type and mEAG1 Y699A channels with 0 or 30 µM fisetin as indicated (n = 6–10). A two-way ANOVA reported differences between these four groups of data (P < 0.05). The Tukey–Kramer post-hoc test also revealed significant and nonsignificant differences between treatments, indicated with an asterisk or n.s., respectively.

