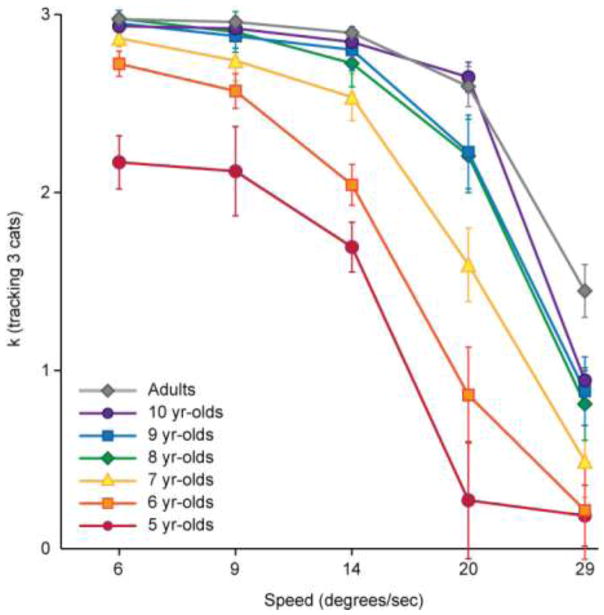
Figure 3.
K-values for the entire group of typical children (N = 76), binned by age, across the five speeds while children tracked three objects. Adults (N = 20) are included in the graph for illustrative purposes but were not included in the main ANOVA investigating developmental change. Developmental change between the ages of 5 and 10 is evident, with further development after the age of 10 only evident at the highest speed

