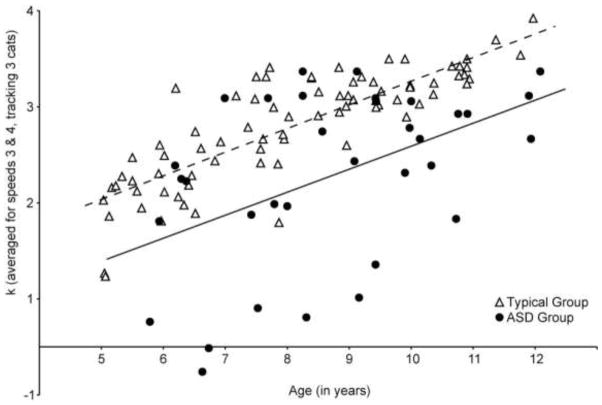
Figure 4.
Individual k-values for the entire group of typical children (N = 79) and the group of children with ASD (N = 34) plotted against age to show developmental change in both groups. The dotted line is the line of best fit for the typical group while the solid black line shows the line of best fit for the ASD group

