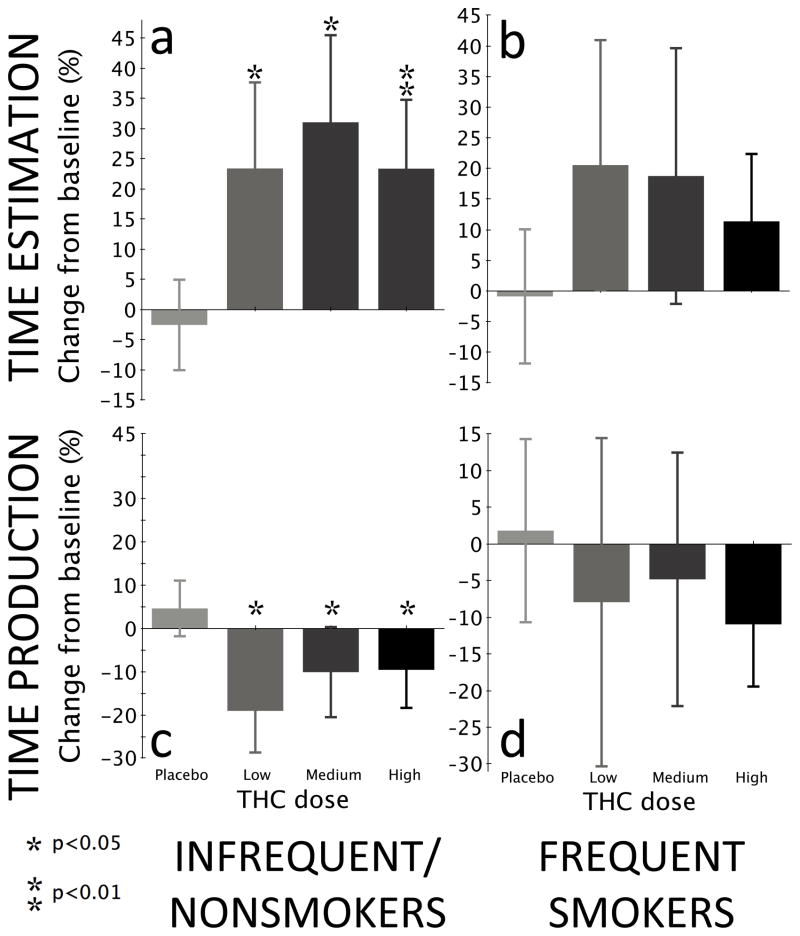
Fig. 1.
Time estimation and production by THC dose for all subjects, frequent cannabis smokers, and infrequent/nonsmokers. Bars represent the change in the ratio of reported time between baseline (before drug or placebo administration) and peak drug effect, in other words (truebaseline × estimatedpeak)/(truepeak × estimatedbaseline). If the same trial duration had been given at both peak and baseline (which it was not), this would simplify to estimatedpeak/estimatedbaseline. The same calculation holds for time production. This is a simple within-group comparison, as opposed to the linear mixed model depicted in Tables 2 and 3.

