
Fig 3.
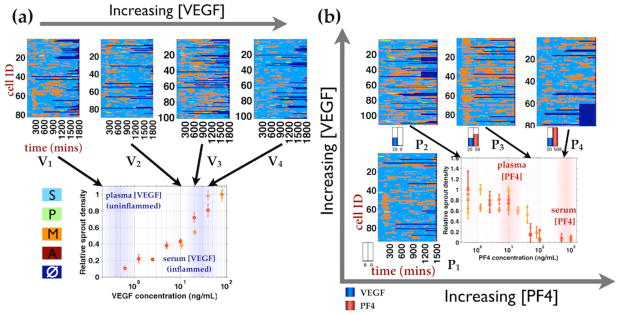
Phenotypic state labeled cell trajectories of hMVEC treated with physiologically relevant VEGF and PF4 concentration ranges. Single cell state trajectories are plotted over time along the rows and phenotypic states are colored labeled as follow: Sessile(S) - aqua; Migratory (M) - orange; Proliferative (P) - pale green; Apoptotic (A) - dark red, and No data (□) - dark blue. The corresponding dose response curves of hMVEC sprout densities under VEGF and PF4 treatments are shown underneath the single state cell trajectories plots. (a) hMVECs were treated with VEGF concentrations within the transition region of hMVEC sprouting dose response curve in collagen gel invasion assay (fig S2), which is the same setup as the imaging experiment (Fig 1). V1, …, V4 = 0, 10, 20, 40 ng/mL VEGF. (b) hMVECs were treated with PF4 concentrations spanning with transition region of PF4 dose response curve in the background of physiological VEGF concentration (20 ng/mL). P1 = no cytokine, P2, …, P4 = 0, 50, 500 ng/mL PF4 in the background of 20 ng/mL VEGF.