
Fig 6.
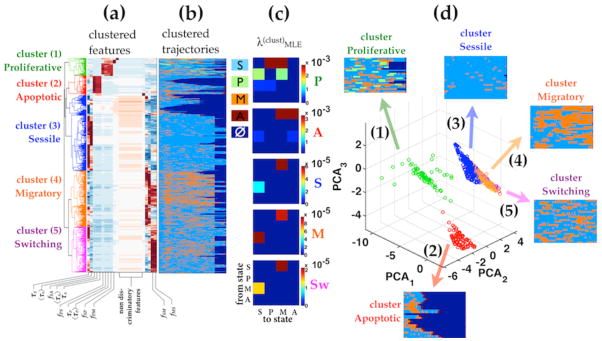
Hierarchical clustering of all cell trajectories in all cytokine conditions reveals 3–5 identifiable clusters. Hierarchical clustering was performed based on the trajectory features described in Table 2. (a) Dendrogram of the clustered features and (b)the corresponding clustered single cell trajectories. Clusters color labels are consistent from (a – d). (c) The corresponding transition rate MLEs computed from the single cell trajectories in each cluster separately λ(clust). The transition rates matrices in sessile, migratory and switching clusters are qualitatively similar. Under DPM, the effect of cytokine treatment can described as changes in the fraction of cells adopting different dynamic phenotypic transition patterns (also referred to as cluster weights). (d) Principle component projections of cell trajectories shows the separation of the endothelial subpopulations. The apoptotic and proliferative clusters (1 and 2) are well separated in state transition dynamics from each other and from the sessile, migratory, and switching clusters. Sessile, migratory and switching clusters (3, 4, 5) consist of cells that transition between sessile vs. motile states and are only differentiated by the frequencies of transition and the dwell times within the sessile vs. motile states.