
Table 2.
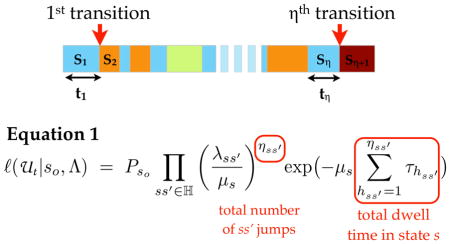
A hypothetical state trajectory with η state transitions. States are color-labeled. According to the continuous time Markov (CTM) model, the likelihood of a particular transition rate parameter set Λ given the observed state trajectory U is a product of the likelihoods of all individual transitions observed in the trajectory, and the marginal probability of the first state So (PSo). After an arithmetic manipulation, the likelihood can be written as in Equation 1 (details in Supplementary Modeling Approaches 2.1). The likelihood expression contains two types of experimentally obtainable variables. The first is the total number of transitions of certain type ss′ (ηss′). The second set is total dwell time in a certain state s (Σhτh). Since these variables are involved in determining the likelihood, they are used as state transition dynamic features for classifying single cell state trajectories.
| |||
|---|---|---|---|
| Feature | Notation | Definition | |
| frequency of ss′ type jumps (trajectory length normalized number of ss′ type jumps) | fss′ |
|
|
| frequency of jumps of all types (trajectory length normalized number of any jumps) | f tot |
|
|
| total dwell time in state s | τtot | Σhs τhs | |
| mean dwell time in state s | τs |
|
|
| variance dwell time in state s | σ2τs |
|
|