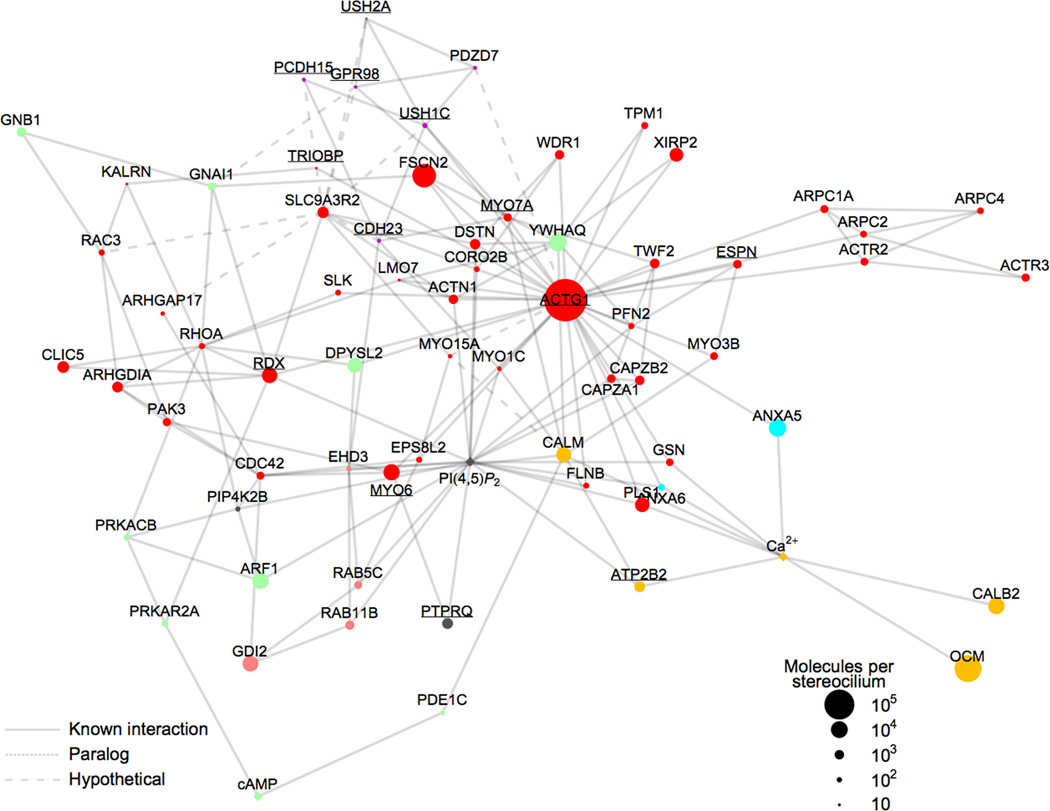
Figure 4.
Interaction network for hair-bundle proteins. Symbols (nodes) represent bundle proteins or second messengers; only nodes with two or more interactions are plotted, with exceptions of OCM and CALB2. Underline labels indicate deafness proteins. Node colors indicate functional classification (same key as in Fig. 2b), while node symbol size represents protein abundance in bundles. Ca2+, PI(4,5)P2, and cAMP are indicated by diamond node symbols. Solid links (lines between nodes) represent interactions validated with literature citations; Supplementary Table 3 lists all interactions and evidence. Dotted links correspond to interactions involving paralogs of bundle proteins; dashed links represent hypothetical interactions (e.g., SLC9A3R2 interactions from Table 3). The layout of the plot is controlled by the density of links between nearby nodes. The distribution of nodes and links in the plot is fit well by a power law, which indicates that the plot contains a few highly connected nodes (hubs) and many other less-connected nodes. Supplementary Fig. 5 reproduces this figure with each link hyperlinked to a PubMed reference supporting the interaction.

