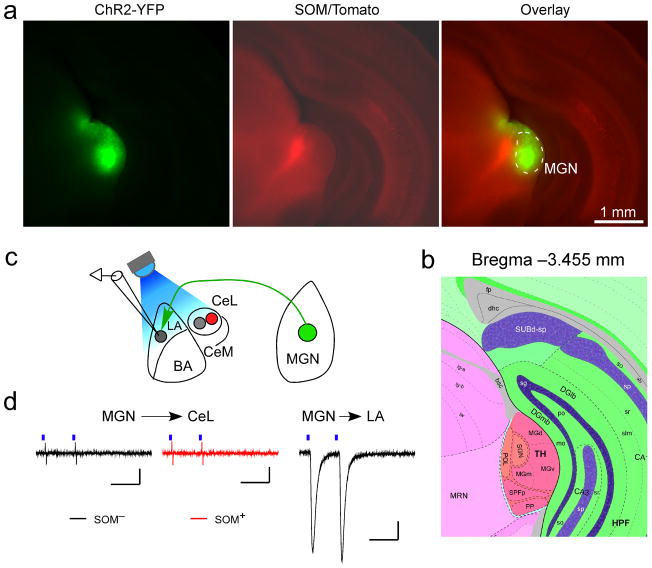
Figure 3. Auditory thalamus does not drive excitatory synaptic transmission onto CeL neurons.
(a) Images of a coronal brain section, which was recovered from a brain used for making acute slices for recording (see c, d), from a SOM-IRES-Cre/Ai14 mouse injected with AAV-CAG-ChR2(H134R)-YFP into the medial geniculate nucleus (MGN) (left, and overlay in the right). Images were taken using an Olympus BX41 histology microscope with a 5x lens. Note the area infected with the virus was large and covered the entire MGN (see b) for the atlas). (b) A section of a brain atlas that contains the auditory thalamus, which is at Bregma −3.455 mm, a level approximately the same as that of the brain section shown in a. The atlas is adapted from the mouse Reference Atlas of Allen Brain Institute. (c) A schematic recording configuration. In green is a ChR2-positive neuron in MGN, in red a SOM+ neuron in CeL. (d) Left: representative EPSC traces recorded from a SOM− (black) and a SOM+ (red) neuron in the CeL. Out of 11 SOM− (2 animals) and 11 SOM+ (2 animals) neurons recorded in CeL, none had any measurable EPSCs. Right: a representative EPSC trace recorded from an LA neuron in the same slice as that used in the left. EPSCs could be readily evoked for all 17 neurons (2 animals) recorded in LA (EPSC amplitude: 154.2 ± 36.6 pA, mean±s.e.m.). Blue bars indicate light pulses (2 ms). Calibrations: 20 pA and 50 ms.

