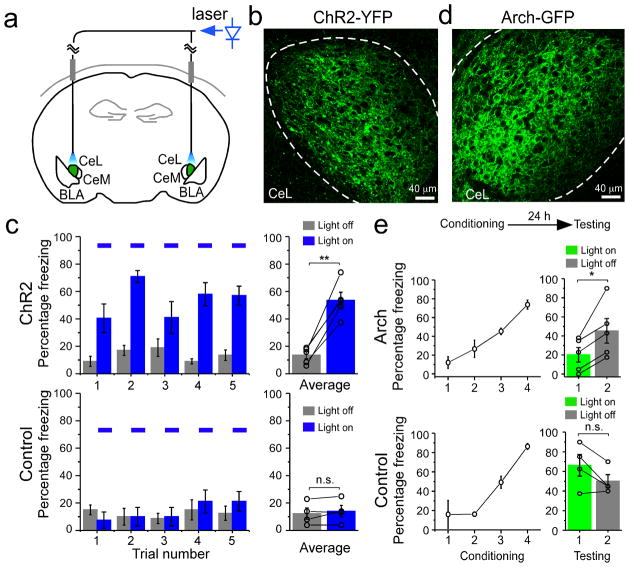
Figure 7. SOM+ neurons in CeL control the expression of fear.
The SOM-IRES-Cre mice were used in these experiments. (a) A schematic diagram showing the experimental design. ChR2-YFP (or Arch-GFP) was expressed in SOM+ neurons in CeL (shown in green) by viral infection. Optic fibers were chronically implanted bilaterally in CeL, and were connected to a blue (for ChR2 activation) or a green (for Arch activation, not shown) laser source. (b) An example image of the SOM+ neurons in CeL infected with the AAV-DIO-ChR2(H134R)-YFP virus. Dashed lines mark the border of CeL. (c) Activation of SOM+ CeL neurons induced fear-like responses in naïve animals. Left: freezing behavior was measured, in repeated trials, before and during the delivery of blue light pulses (blue bars) into the CeL. Delivery of light into CeL induced freezing behavior in animals injected with the AAV-DIO-ChR2(H134R)-YFP virus (ChR2 group, top), but not in animals injected with the AAV-GFP virus (Control group, bottom). Right: level of freezing was averaged for ChR2 animals (top; light off, 13.50 ± 2.63%, light on, 53.50 ± 5.90%, n = 5 animals, t = −7.95, DF = 4, **P < 0.01, paired t-test) and control animals (bottom; light off, 12.25 ± 4.13%, light on, 14.00 ± 4.30%, n = 4 animals, t = −1.13, DF = 3, P > 0.05, paired t-test). (d) An example of the SOM+ neurons in CeL infected with the AAV-DIO-Arch-GFP. Dashed lines mark the border of CeL. (e) Inhibition of SOM+ CeL neurons suppressed conditioned fear expression. Top: a schematic experimental procedure, in which animals were first trained with the fear-conditioning paradigm, and 24 h later tested for fear memory recall. Middle and Bottom panels: animals injected with the AAV-DIO-Arch-GFP (Arch group, middle) or the AAV-GFP virus (Control group, bottom) were fear conditioned (left) and then tested (right). During testing, conditioned freezing was measured in two trials, the first of which was conducted during the delivery of a green light into CeL (light on). Delivery of light into CeL suppressed conditioned freezing in the Arch group (light on: 20.20 ± 7.69%, light off: 45.3 ± 12.91%, n = 5 animals, t = −3.72, DF = 4, *P < 0.05, paired t-test), but not in the control group (light on, 66.25 ± 11.11%, light off, 50.00 ± 6.77%, n = 4 animals, t = 2.39, DF = 3, P > 0.05, paired t-test). n.s. not significant, Error bars, s.e.m.

