
Fig. 3.
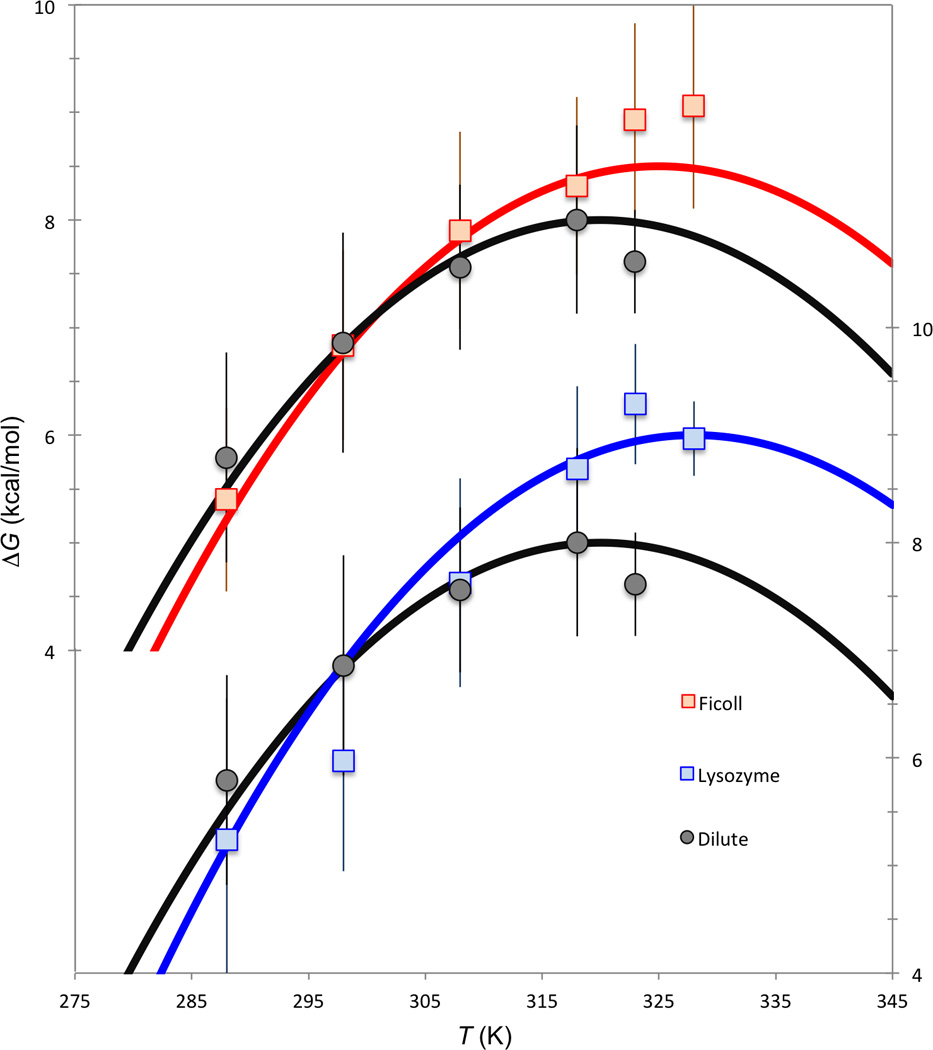
Re-analysis of the Wang et al. [12] data on the folding stability of ubiquitin. ΔCp = 1.5 kcal/mol/K for the dilute solution [12, 28] and for all the crowders; though Wang et al. [12] allowed ΔCp to float in their fitting, this seems uncalled for, given the large uncertainties of the data (see Fig. S1 legend) and the narrow experimental temperature range. Ts = 320 K and ΔHs = 8 kcal/mol for the dilute solution; δTs = 5 and 8 K and δΔH = −7 and −11 kcal/mol, respectively, for Ficoll and lysozyme. Scales on the left are for the upper two curves (Ficoll and dilute) and those on the right are for the lower two curves (lysozyme and dilute); the curve for dilute solution is duplicated to serve as reference for the two crowders.