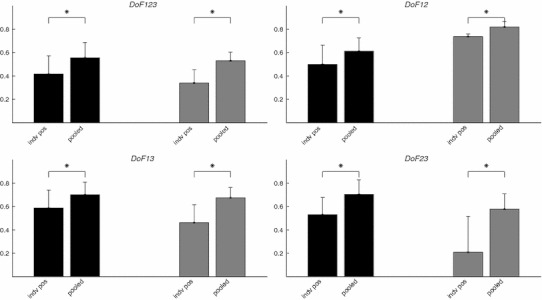
Fig. 5.

The effect of positional pooling in the four analysis scenarios. In each plot, the dark and light bars and the vertical lines are the mean and standard deviation of the R 2 values for amputee subjects, and able-bodied subjects, respectively. As shown in the figures, the positional pooling in MLP training significantly improved the estimation performance, measured by R 2 values. In all cases, one-tail paired t test showed that the R 2 values obtained when the MLPs were trained on pooled data were significantly higher than those obtained when the MLPs were trained on individual positions (indicated by asterisks). The significance level was 95 % for all tests
