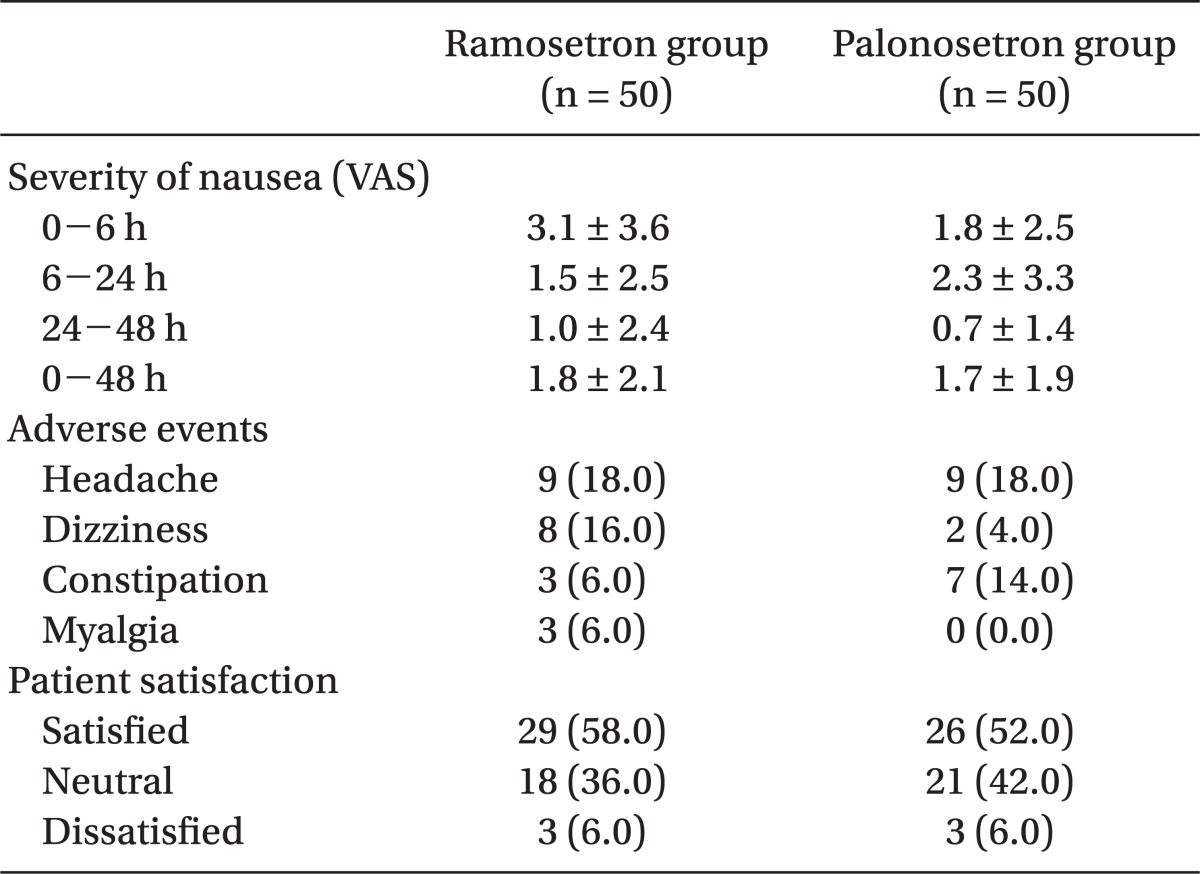
Table 3.
Severity of Nausea, Adverse Events and Patient Satisfaction

Data are presented as number of patients (%) or means ± SD. VAS: visual analogue scale.
Severity of Nausea, Adverse Events and Patient Satisfaction

Data are presented as number of patients (%) or means ± SD. VAS: visual analogue scale.