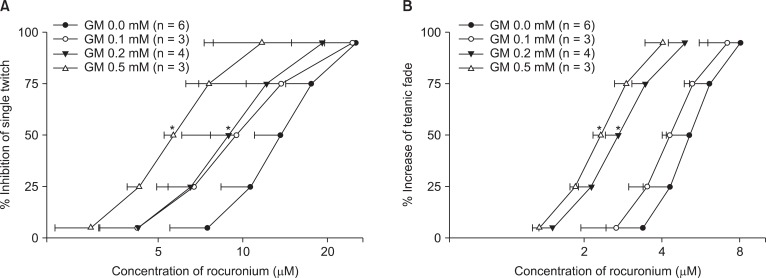
Fig. 2.
The cumulative concentration-response curves of rocuronium on single twitch at 0.1 Hz (A) and tetanic fade at 50 Hz for 1.9 s (B). Gentamicin shifts the concentration-response curves to the left. The concentrations of rocuronium are reported as the mean and the SD. GM represents gentamicin. *P < 0.05, compared with the EC50 for gentamicin 0.0 mM by t-test with Bonferroni's correction.

