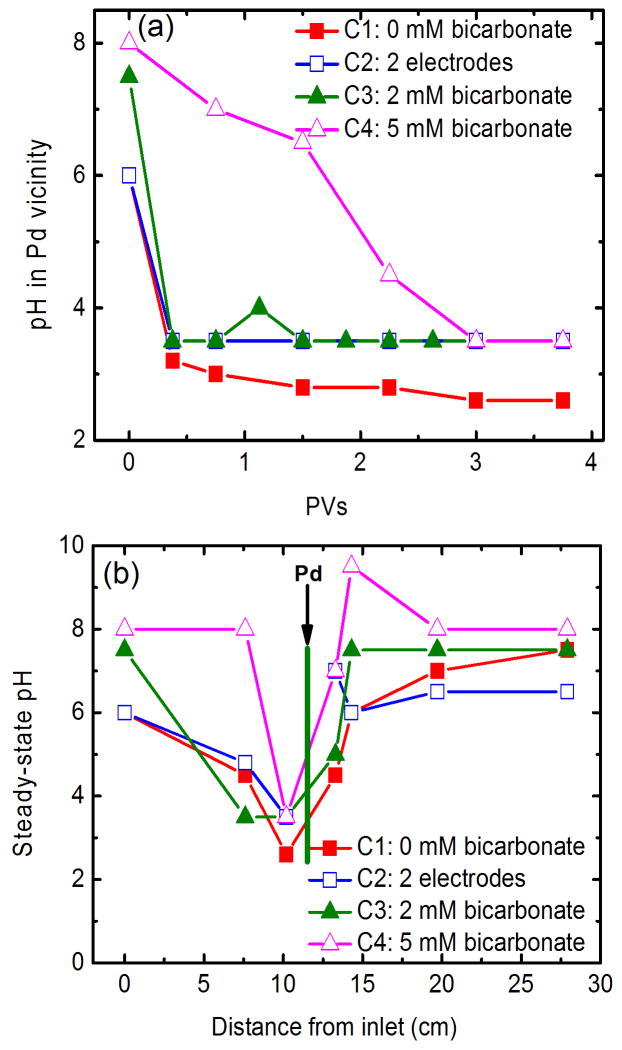
Fig. 2.
(a) Temporal variations of pH within the Pd vicinity and (b) steady-state variations of pH along column. Pd vicinity refers to samples collected form Port P2. Operation conditions are: a flow rate of 2 mL/min and total current of 60 mA with 40 and 20 mA are distributed through Cathodes 1 and 2, respectively. Note for C2 (2 electrodes only) no current passed through Cathode 2.

