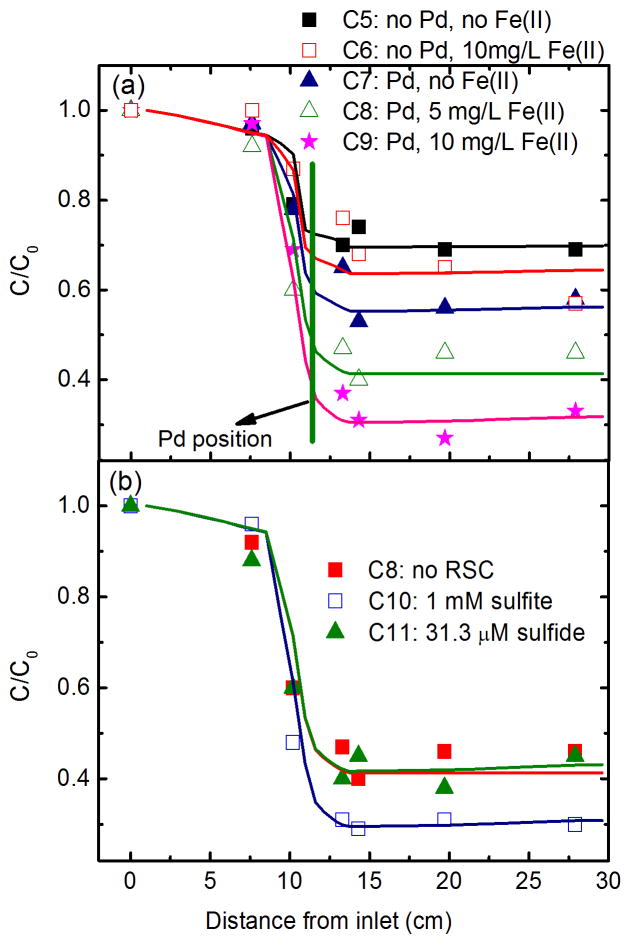
Fig. 3.
Steady-state variation of TCE along the columns (a) at different column conditions and (b) in the presence of RSCs. Curves refer to the simulated results corresponding to the data point in the same color. Initial concentrations of TCE was 5.3 mg/L. Operation conditions are: a flow rate of 2 mL/min and total current of 60 mA with 40 and 20 mA distributed through Cathodes 1 and 2, respectively.

