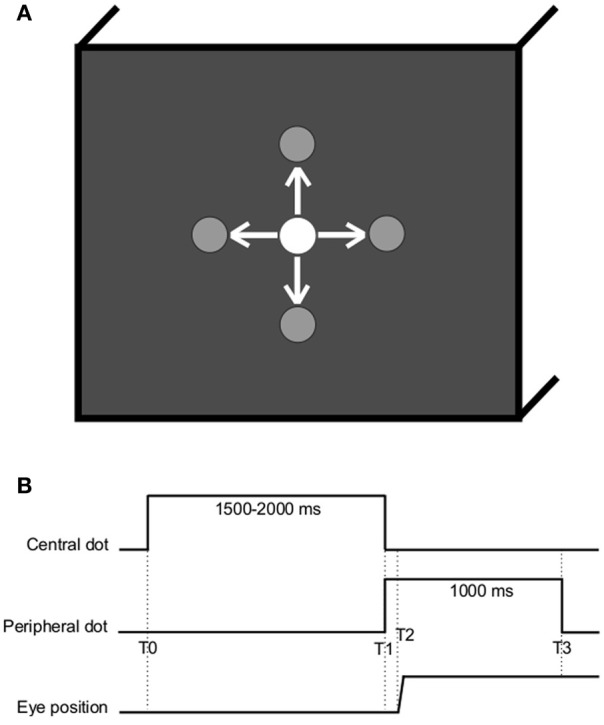
Figure 1.

(A) Spatial arrangement. The white dot is here represented at the center but could be located at one of the other peripheral locations (gray), at ±10° horizontally or vertically. Arrows represent the possible saccade stimulation. (B) Temporal arrangement (T0, central dot turns on; T1, central dot cuts off and peripheral dot turns on; T2–T1, latency of ocular response; T3, peripheral dot cuts off).
