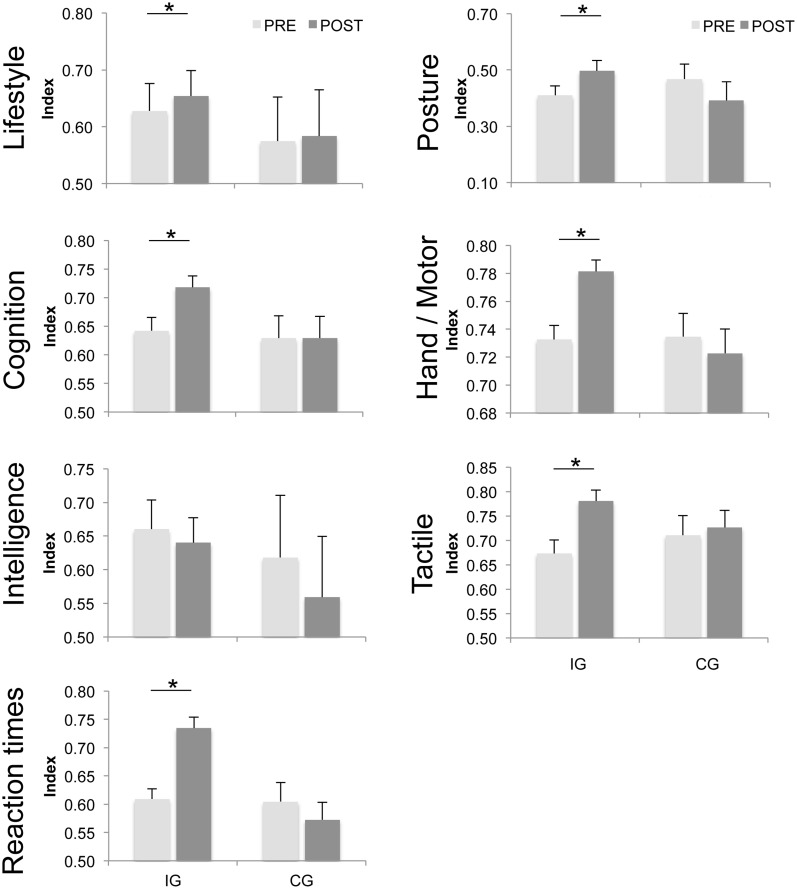
Figure 1.
Average indices of individual performance (IP). Average indices of performance (IP) for subjects in the intervention and control groups before (PRE) and after (POST) a 6-month period of either dancing (IG) or no intervention (CG). Higher indices were found for the IG group in 6 out of 7 domains after 6 months of dancing intervention. “Cognition” (p ≤ 0.001) comprises the geriatric concentration test (AKT), Raven Standard Progressive Matrices (RSPM), Frankfurt Attention Inventory (FAIR), and Non-Verbal Learning Test (NVLT). “Reaction times” (p ≤ 0.001) comprise multiple-choice reaction times for the left and right hands and Reaction time analysis. “Hand/Motor” (p ≤ 0.001) comprises steadiness, aiming, pin plugging, and tapping of both hands. “Tactile” (p ≤ 0.001) comprises touch-threshold, 2pd, and haptic object recognition. “Intelligence” (p = 0.215) comprises RSPM. “Lifestyle” (p = 0.004) comprises life contentment (FLZ), and “Posture” (p = 0.001) comprises posture subtests 1–7. The vertical bars show standard errors of the mean. Asterisks mark significant differences before and after the intervention or after 6 months of no intervention respectively.

