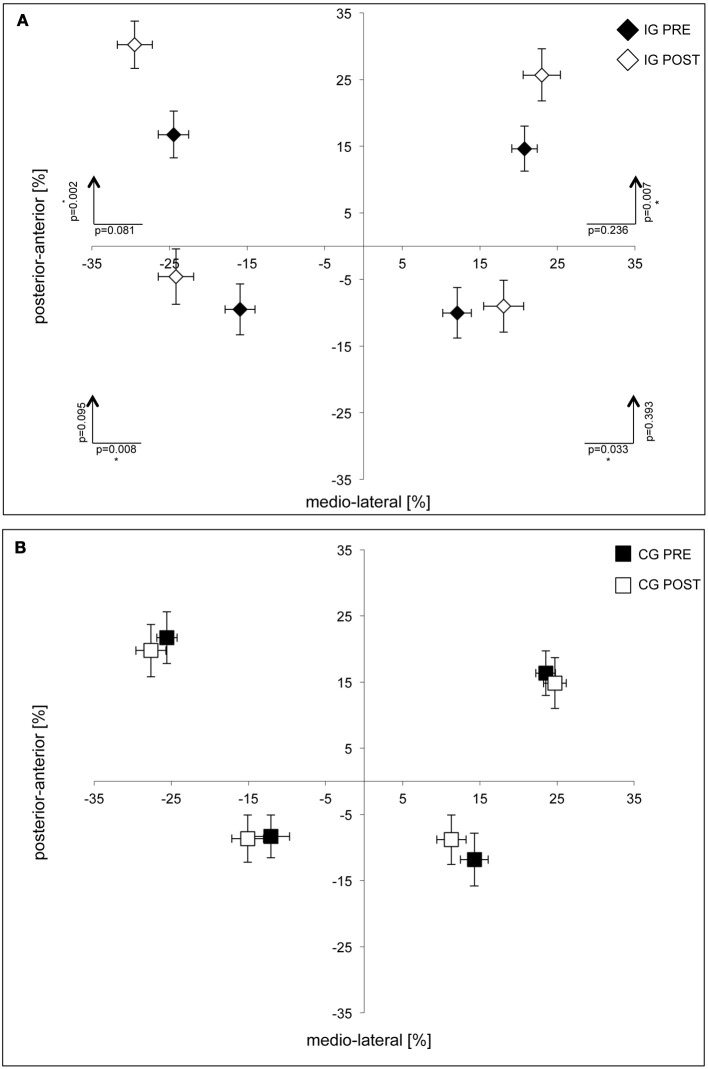
Figure 2.
Group data of postural performance for subjects in the intervention (A) and control groups (B). Averaged COP deviations are shown as percentage changes in relation to origin of the coordinate system. Significant deviations were found in the IG group in the anterior direction for subtest 4 (upper right) and 5 (upper left) and in the lateral direction for subtest 6 (lower right) and 7 (lower left). No differences were found for subjects in the CG group. Standard deviations of average COP-positions (horizontal and vertical bars) are given for the medio-lateral and anterior-posterior directions.

