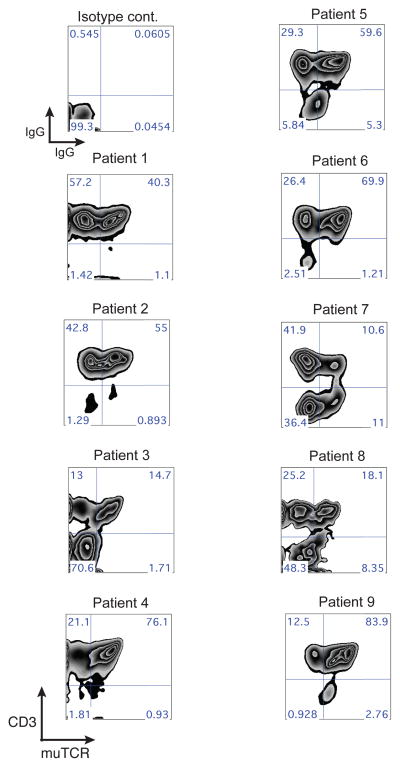
Figure 2.
Persistence of MAGE-A3 TCR post-infusion. Shown are the FACS density dot plots from patients PBMC isolated approximately one-month post-infusion. Scatter plots depict CD3+ and murine MAGE -A3 TCR beta chain expression on lymphoid cells, with the percentages of positive cells indicated in each quadrant. muTCR, murine beta chain TCR.

