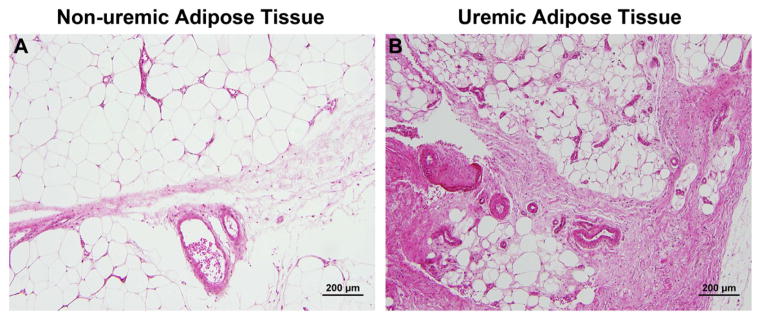
FIG. 1.

Representative hematoxylin and eosin stained microscopic images from non-uremic (panel A) and uremic (panel B) subjects are shown. Uremic subjects showed increased interlobar fibrosis, increased microvascular density, increased vascular wall hypertrophy, scattered fat necrosis, and lower adipocyte volumes as compared to non-uremic subjects. Scale bar = 200 μm.
