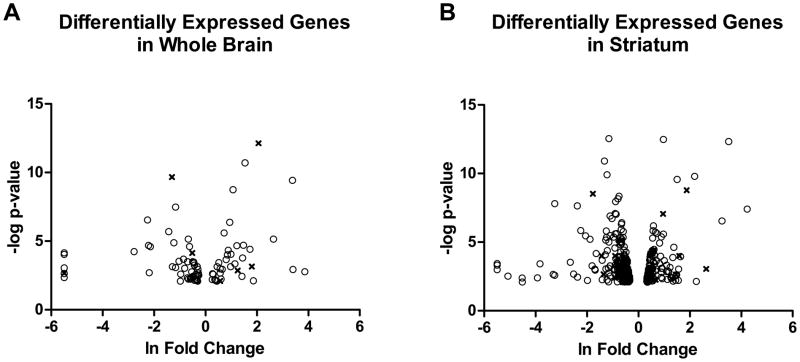
Figure 1.
Differentially expressed genes in whole brain and striatum.
Figure 1 displays the distribution of differentially expressed genes between strain in Whole Brain (A) and Striatum (B) samples. The x-axis represents the natural log of the fold change, with positive values corresponding to higher expression in ILS mice, and negative values corresponding to higher expression in ISS mice. The y-axis represents the negative log of the p-value of the difference in expression, with more significant differences corresponding to higher numbers. Open circles (82 WB, 305 ST) represent genes significant at a False Discovery Rate (FDR) of 0.1. X’s (8 WB, 31 ST) represent genes lying in Lore QTL regions.

