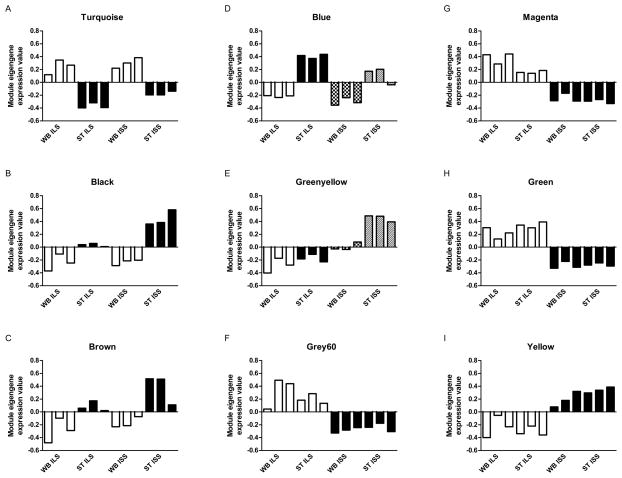
Figure 2.
WGCNA module eigengene expression levels.
Figure 2 displays the calculated expression level of module eigengenes, the first principle component of each module expression pattern. Individual mouse samples (bars) are in groups of 3 for each set of whole brain ILS, striatum ILS, whole brain ISS and striatum ISS. Only module eigengenes significant for strain or region differences are shown. Module eigengenes reduce the expression value of all genes in the module to one value per sample. An ANOVA of each module eigengene reveals modules different by region (A–C), both region and strain (D–E), and strain (F–I). No module eigengenes had significant strain × region interactions.

