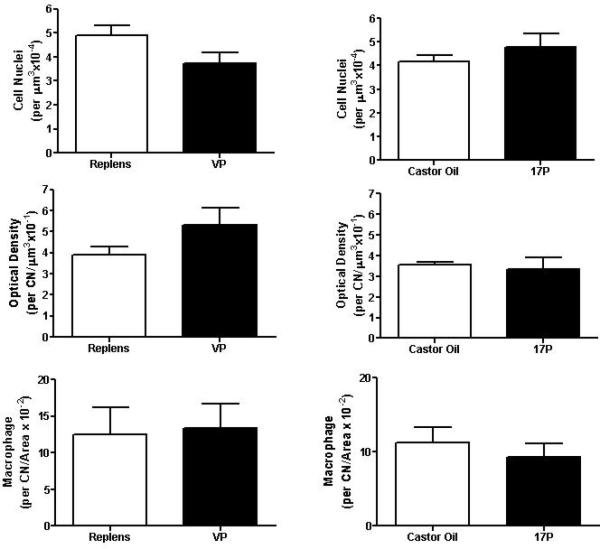
Figure 2.

Bar graphs depicting the mean and the SEM (n=3 per treatment group) of the number of cell nuclei per area, optical density of birefringence of transmitted polarized light, and number of macrophages in the cervix from mice receiving the four treatment groups, unpaired Student's t-test.
