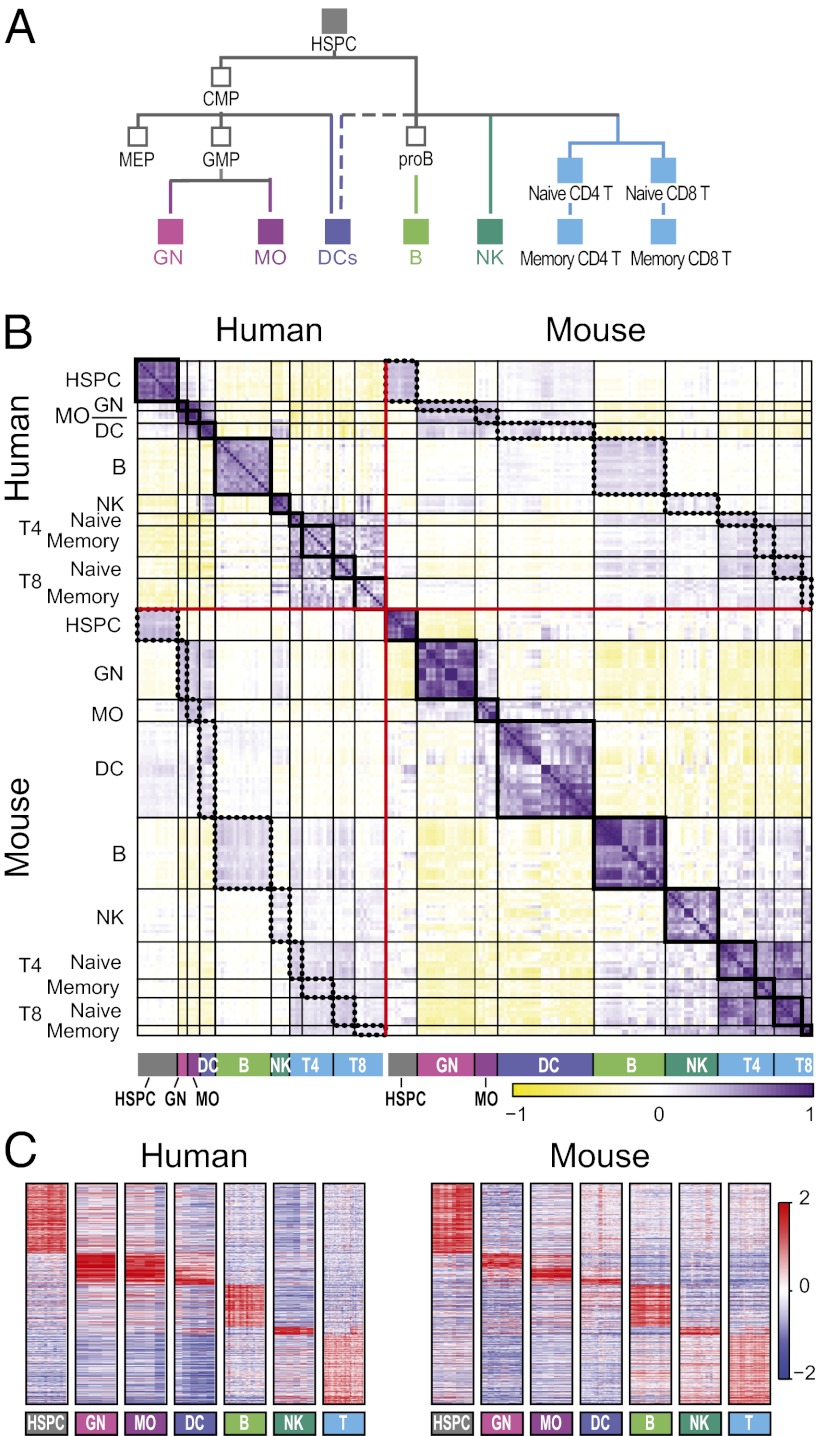
Fig. 1.
Conserved transcriptional profiles in matched immune lineages between human and mouse. (A) Simplified lineage tree for the immune system cell populations measured in both human and mouse compendia. CMP, common myeloid progenitor; GMP, granulocyte–monocyte progenitor; MEP, megakaryocyte–erythroid progenitor. Filled rectangles, cell types included in the common lineages. Colors mark those lineages in all figures. (B) Global correlation matrix of the Pearson coefficients (yellow/purple color scale on the bottom) between every pair of human and mouse samples in the common lineages. Samples are in rows and columns sorted by the lineage tree. Red lines separate species, black lines separate lineages, thick black rectangles mark correlations within each lineage within a species, and dotted rectangles mark correlations between samples of the same lineage between species. (C) Mean-centered expression values (red/blue color scale on the right) of the genes shared between matching lineage signatures in human (Left) and mouse (Right). Signatures were defined in each species separately as composed of genes that are expressed in a lineage-specific pattern in that species. Every pair of matching signatures was compared between the species to identify all those pairs of orthologs that were members of both signatures. Genes are sorted by human lineage with maximal expression level.

