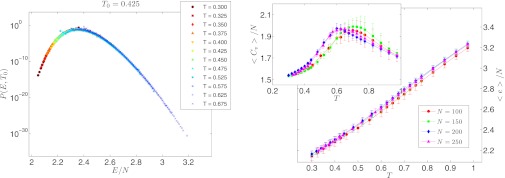
Fig. 2.

(Left) Collapse of distribution of energy P(E) for different temperatures on the distribution of P(E, T0) with T0 = 0.425 in the parallel tempering run for N = 100 system size according to Eq. S3 to check the equilibration. The nice collapse confirms that very good equilibration is achieved using the parallel tempering method for lower temperatures. (Right) Temperature dependence of the energy for different system sizes. One can see that the finite size effect is not very strong here. (Inset) Specific heat calculated from the fluctuation of potential energy for different system sizes. Some finite size effects may be seen here.
