Fig. 1.
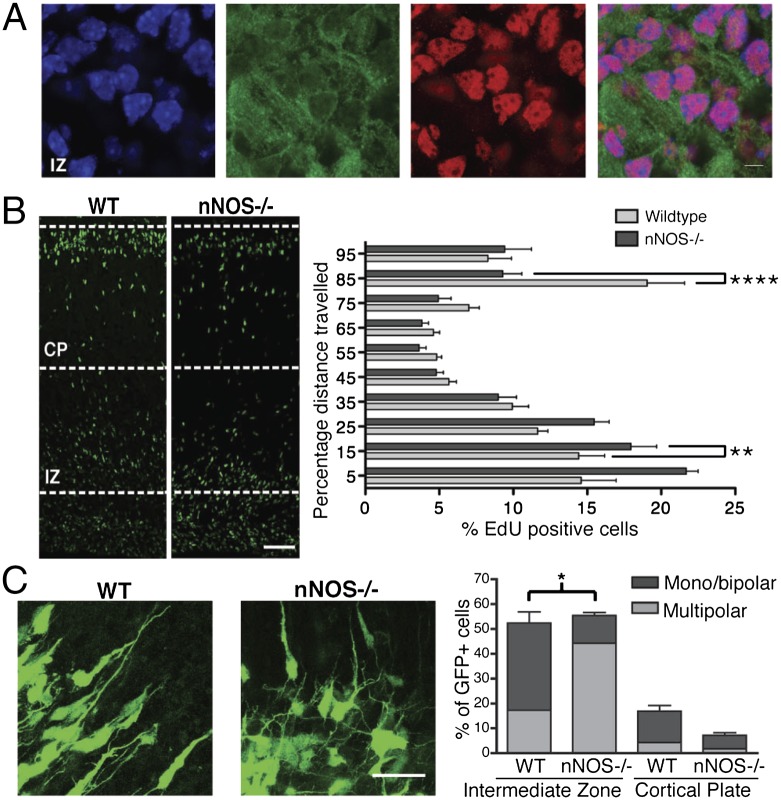
Lack of nitric oxide signaling impairs radial neuron migration. (A) Images of the IZ of E15.5 sagittal sections stained with DAPI (blue), anti-nNOS (green), and anti-HDAC2 (red). (Scale bar, 30 µm.) n = 3. (B) Images of WT and nNOS−/− cortices from embryos of E15.5 mice injected with EdU, killed 72 h after injection. Quantitative analysis of EdU-positive neurons as percentage distance from VZ. Shown are averages and SEM; **P < 0.01, ****P < 0.0001, two-way ANOVA, Bonferroni post hoc test. (Scale bar, 50 µm.) WT embyos, n = 10; nNOS−/− embryos, n = 9. (C) (Left) Embryos were ex vivo electroporated at E14.5, and organotypic slices were cultured for 3 d in vitro. The images show eGFP-expressing neurons within the IZ. (Right) Quantitative analysis was performed by calculating the percentage of GFP cells within either the IZ or the CP with monopolar/bipolar or multipolar morphology. (Scale bar, 50 µm.) Averages and SEM, n = 3; *P < 0.001, two-way ANOVA, Bonferroni post hoc test.

